Hi there,
we’re using SciChart with up to 4 y-axes per chart.
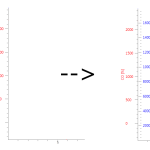
The y-axes take up quite a bit of horizontal space so we were wondering if there was any way to reduce the amount of space taken by e.g. displaying two axes on one vertical line.
What we mean is that axis A will have its tickmarks and numbers on the left side of the vertical line and axis B will have its tickmarks and numbers on the right side of the line.
Is such a thing possible at all with the current version of SciChart or do you have any other idea how one could reduce the amount of horizontal space taken up by the y-axes?
Best regards,
Joerg
- Joerg Hoehn asked 12 years ago
- You must login to post comments
Hi Joerg,
take a look at the attached. We’ve had a go at creating this chart using only control templates (no modifications to the scichart source code, so this will work with v1.3.5.1225).
What we’ve done is basically override the ControlTemplate for the chart, and setting a fixed size for the axes, used margin/padding creatively to align the axis areas so that the left/right axes groups appear as per your screenshot.
There are a few minor problems with this though – firstly the axis size must be fixed. Secondly one of the left axes doesn’t flip (HorizontalAlignment is ignored). Finally if you use a RubberBandXyZoomModifier in here, when you drag the axis to scale because the mouse is simultaneously over the axis and chart, both modifiers fire.
I suggest the following – take a look at this. Is it moving in the general direction for your needs? This would make a good blog article if we can get it to work, however I’m hesitent to make changes to SciChart just for this feature, it would be good if we can get it working with just overrides / control template changes!
Best regards,
Andrew
- Andrew Burnett-Thompson answered 12 years ago
- You must login to post comments
Please login first to submit.


