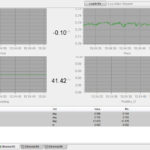
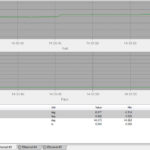
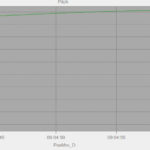
We have a motion sensor for which we present a real time graph. As can be seen from the attached image, my YAxis configuration (auto range) causes the yaxis scale to display noise in a way that is rather disturbing (see attached image).
I have tried to do some fiddling with the axis settings, but with no luck so far.
The YAxis perfectly follows the measured data, but when there is practically no motion, the graph should be shown as an almost straight line, preferably not in the upper or lower end of the scale.
- Guest asked 7 years ago
-
Example: The sensor has stabilized on a heading value around 234 degrees. The data value range is 233.97 to 234.03 degrees. My implementation will cause the YAxis to be from 233.97 to 234.03 degrees, and the full range of “noise” will be drawn in the graph. I would rather have an YAxis limited to show e.g. a range of 0.5 to 1 degrees, which would cause an almost straight line to be displayed. And I would also like the visual range of the YAxis to be set in a way that the straight line appears close to the middle of the yaxis after a period of turn, say from 225 to 233 degrees. I am pretty sure this is not a new problem for SciChart users, but as a novise user, I have not managed to find an article on the forum that helps. Any hint is highly appreciated.
- You must login to post comments
I still have the problem that if measured value is below initial yaxis range, y axis is not changed until I have moved the sensor. What have I missed?
(see next figure)
- Guest answered 7 years ago
- You must login to post comments
I am not sure I have understud how to use available information. The following code was written to experiment with OnCalculateNewYRange(), but it does not seem to have any positive effect on my graphs:
      protected override IRange OnCalculateNewYRange(IAxis yAxis, RenderPassInfo renderPass)
  {
     var baseRange = base.OnCalculateNewYRange(yAxis, renderPass) as IRange<double>;
     if (renderPass.DataSeries == null || baseRange == null) return baseRange;

     var latest = renderPass.DataSeries.LastOrDefault();
     if (latest?.LatestYValue == null) return baseRange;


     var t = latest.GetType();
     var min = (double)latest.YMin;
     var max = (double)latest.YMax;
     if (min > max) return baseRange;

     var diff = baseRange.Diff;
     if (double.IsInfinity(diff)) return baseRange;
     var lastValue = (double)latest.LatestYValue;

     if (Math.Abs(baseRange.Max - max) > diff * .7)
     {
        // max of timeseries much lower than max of yaxis, so have lower limit increase;
        baseRange.GrowBy(-0.1, 0);
     }
     else if (Math.Abs(baseRange.Min - min) > diff * .7)
     {
        //min of timeseries much higher than min of yaxis, so have upper limit decrease
        baseRange.GrowBy(0, -0.1);
     }
     else if (baseRange.Max - lastValue < diff * .1)
     {
        // value close to upper limit - pan y axis upwards
        baseRange.GrowBy(-0.1, 0.1);
     }
     else if (lastValue - baseRange.Min < diff * .1)
     {
        // value close to lower limit - pan y axis downwards
        baseRange.GrowBy(0.1, -0.1);
     }

     return baseRange;
  }
This method is called, but it does not have the effect I expected. (see new attached image)
- Guest answered 7 years ago
-
Silly me: was better when I assigned baseRange.GrowBy() to a var newRange and returned that instead ;-)
- You must login to post comments
Image attached now.
- Guest answered 7 years ago
 I would look into the ViewportManager API. Here you can override the AutoRange calcs. Call the base to get what SciChart thinks is the AutoRange range, then manipulate it. Let me know if you have any questions!
- You must login to post comments
Thank you Andrew, that article really helped.
I added MinimalZoomConstrain to the YAxis style, and now the noise is not as visible.
           <SciChart:SciChartSurface.YAxis>
            <SciChart:NumericAxis Style="{StaticResource yAxisStyle}"
                                  MinWidth="35.0"
                                  TextFormatting="0.00"
                                  AxisAlignment="Left"
                                  AutoTicks="True"
                                  AutoRange="Always"
                                  GrowBy="0.05, 0.05"
                                  MinimalZoomConstrain="0.1"
                                  DrawMinorGridLines="False"
                                  DrawMinorTicks="True"
                                  VisibleRange="{Binding ChartYVisibleRange, Mode=OneWayToSource}"
                                  MajorDelta="{Binding ChartYMajorDelta, Mode=TwoWay}"
                                  MinorDelta="{Binding ChartYMinorDelta, Mode=TwoWay}">
            </SciChart:NumericAxis>
        </SciChart:SciChartSurface.YAxis>
Is it possible to have autoscaling trying to position the graph towards the vertical center of the graph viewport?
See attached graph of vertical position.
- Guest answered 7 years ago
 Hi Morten, there is no image attached? Anyway, — anything is possible with SciChart it’s just a question of how :) You can try to manipulate VisibleRange directly in the VisibleRangechanged event handler, or, better you can use our ViewportManager API to override the actual AutoRange calculations. See https://www.scichart.com/documentation/v4.x/ViewportManager%20-%20Full%20Control%20over%20Axis%20Ranges%20and%20Viewport.html
-
Image was too large. I’ll try to re-post it.
-
Not too large. But the jpg file was rejected.
- You must login to post comments
Hi Morten,
I know I’ve emailed you about this! For the benefit of our community, and search, please find an answer below.
We do this in one of our applications. This is where we want to AutoRange, but to clamp the YAxis Minimum to zero.
        <s:SciChartSurface.YAxes>
            <s:NumericAxis GrowBy="0.0, 0.1" AutoRange="Always"
                           VisibleRangeLimit="0, 0" VisibleRangeLimitMode="Min"  />
        </s:SciChartSurface.YAxes>
The VisibleRangeLimit / VisibleRangeLimitMode can handle this. VisibleRange Limit Documentation is here.
There are a few suggestions in the documentation above.
Any questions please ask!
Best regards,
- Andrew Burnett-Thompson answered 7 years ago
- You must login to post comments
Please login first to submit.


