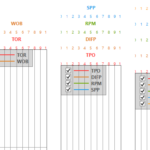
I have a series of charts with flipped coordinates, and each chart has multiple x-axes at the top (see screenshot). I’ve successfully added titles to the axes but I’m stuck trying to figure out how to reduce the spacing between the titles and the axis labels. In the included screenshot, it is apparent that a lot of real estate is being eaten up by this. These charts are generated dynamically so I need a code, not xaml, solution. I’ve looked into a lot of axis title styling examples but all use a xaml approach, and I’m having trouble translating that style info into code. Could anyone suggest what class(es) to use in the axis constructor, or provide a brief example?
- Seward Pulitzer asked 6 years ago
- You must login to post comments
We Buy Houses Albuquerque. Need to sell a house fast? We buy houses in any condition. Get a fair cash offer on your home today! Sell Your House Fast in Albuquerque and Surrounding Areas. We’re not realtors, we’re local cash home buyers in Albuquerque and we can buy your house fast with a fair all cash offer. We buy houses quickly and close on your schedule!
- Guest answered 2 years ago
- You must login to post comments
Hi Seward,
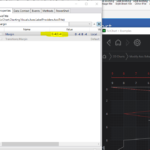
The best tool to diagnose these sorts of things is WPF Snoop. Also the Visual debugger built in to Visual Studio 2017 does the same thing.
You point it at your application, hit ALT+SHIFT and it focuses on elements. Now you can change properties & parameters to find out how to change your view in real-time.
In this case adding a negative margin to AxisTitle seems to do the trick.
Our article Templating the Axis Title shows how to apply styles to the Axis Title. The solution is in XAML, as you will need to create a style to apply to the AxisTitle. You can do this in code but it is a nightmare to write styles in code. What I would suggest instead is to declare your style in XAML and apply it in code.
- Andrew Burnett-Thompson answered 6 years ago
- You must login to post comments
Please login first to submit.


