Good day, everybody!
I’ve got a problem. I’m working with inherited class from LineAnnotation- MarkerLineAnnotation. I’ve added some fields to the class. When I set X1=0 and X2=100000, displayed the element on SciChartSurface, I tried to zoom in. But after a few zooms my MarkerLineAnnotations had disappeared.
After that situation I set X1=0 and X2=10000 and tried to zoom in. I could zoom in my custom annotations for a long time, but they had disappeared too.
How can I solve this problem?
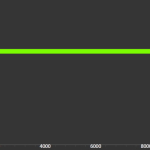
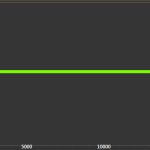
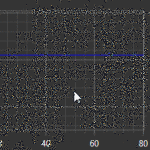
I’ve attached screenshots describing this problem. (Image 1-normal size for line with X1=0 and X2=10000 , Image 2-zoom, when disappearing took place for line with X1=0 and X2=10000; Image 3-normal size for line with X1=0 and X2=100000 , Image 4-zoom, when disappearing took place for line with X1=0 and X2=10000)
Thanks in advance.
- Egor asked 10 years ago
- last edited 10 years ago
- You must login to post comments
Hi Egor,
Thank you for your patience with this and sorry for a delayed response! We’ve investigated the issue and it appeared to be a wpf issue. You could find it discussed at StackOverflow. So to workaround it, you need to set both ends to XAxis.VisibleRange.Min/Max instead of a large numbers outside the viewport.
Would it be a suitable solution for you? May I ask, what is your purpose of setting ends to such values, maybe we can suggest some alternative way to you?
Also FYI I logged the issue, we’ll discuss it and consider if something can be done to improve this behavior on our side.
Best regards,
Yuriy
- Guest answered 9 years ago
- last edited 9 years ago
 Thank you for your answer! I thought that there was a funtion that can make it visible when zoom in. So I will discuss this problem with colleagues. Have a good day!
- You must login to post comments
Hello again! Is there any result with this problem?
- Egor answered 10 years ago
- You must login to post comments
Good day!
Thank you for the reply! I’ve recorded a work of the test project in a gif file and there is an example in zip archive. I’ve attached it below.
Steps to reproduce the error:
1)launch the program
2)zoon in it several times with mouse wheel
- Egor answered 10 years ago
- last edited 10 years ago
- You must login to post comments
Please login first to submit.


