Hello,
I would like to use the RolloverModifier to display a given datapoint’s identification (string) metadata. The solution suggested in this link on correlating metadata to datapoints seems promising, but for the fact that I have multiple charts to display simultaneously, hence I need multiple lookup arrays. I originally thought to use a ValueConverter that would manage lookup of the identification value based a chart view model instance code (ChartId) and the index provided in the XyzDataSeries. As control charts are instantiated, they register with the ValueConverter, which maintains a static lookup dictionary. In the XAML, the ZValue is passed as the value and the chartID is passed as a parameter to the ValueConverter. I have run into a couple key challenges, however:
- ConverterParameters cannot be bound; hence I cannot bind to the ChartId, whether it is stored in a viewmodel or in a different XAML element.
- WPF does not allow use of nested value converters in XAML; this prevents me from nesting the ValueConverter within the chart view model (where reference to the ChartId is readily available).
I’m exploring some other options, but they are getting ugly fast, so I figured it’s time to ask for assistance. Is there another way to do this (desirably adhering to MVVM practices)?
Key excerpts of my code are pasted below:
Surface:
<TextBlock x:Name="ChartIdBlock" IsEnabled="False" Text="{Binding ChartId}"/>
<s:SciChartSurface x:Name="ScsControlChart" MinHeight="200" s:ThemeManager.Theme="BlackSteel">
<s:SciChartSurface.RenderableSeries>
    <s:FastLineRenderableSeries x:Name="Data" SeriesColor="White" DataSeries="{Binding Chart, Converter={StaticResource ChartDataToDataSeriesConverter}}" IsSelected="True"/>
   <!-- More data series in same chart -->
</s:SciChartSurface.RenderableSeries>
<s:SciChartSurface.XAxis>
    <s:DateTimeAxis  VisibleRange="{Binding XRange, UpdateSourceTrigger=PropertyChanged, Mode=TwoWay}" TickLabelStyle="{StaticResource AxisLabelStyle}" />
</s:SciChartSurface.XAxis>
<s:SciChartSurface.YAxis>
    <s:NumericAxis DrawMajorBands="True" VisibleRange="{Binding YRange, UpdateSourceTrigger=PropertyChanged, Mode=TwoWay}" TickLabelStyle="{StaticResource AxisLabelStyle}"/>
</s:SciChartSurface.YAxis>
<s:SciChartSurface.ChartModifier>
    <s:ModifierGroup>
        <s:RolloverModifier x:Name="RolloverModifier" DrawVerticalLine="True" SourceMode="SelectedSeries" TooltipLabelTemplate="{StaticResource RolloverLabelTemplate}"/>
    </s:ModifierGroup>
</s:SciChartSurface.ChartModifier>
RolloverLabelTemplate:
<ControlTemplate x:Key="RolloverLabelTemplate" TargetType="s:TemplatableControl">
    <Border Grid.Row="1" HorizontalAlignment="Left" VerticalAlignment="Top" Background="#77FFFFFF" BorderBrush="#55000000" BorderThickness="1" Padding="5">
        <ItemsControl ItemsSource="{Binding ElementName=RolloverModifier, Path=SeriesData.SeriesInfo}">
            <ItemsControl.ItemTemplate>
                <DataTemplate>
                        <StackPanel Grid.Column="2" Orientation="Horizontal" Margin="3,3,20,3">
                            <TextBlock FontSize="13" FontWeight="Bold" Foreground="{Binding SeriesColor, Converter={StaticResource ColorToBrushConverter}}"
                                       Text="{Binding ZValue, Converter={StaticResource IndexToIdConverter}, ConverterParameter={Binding ElementName=ChartIdBlock, Path=Text}}"/>
                        </StackPanel>
                </DataTemplate>
            </ItemsControl.ItemTemplate>
        </ItemsControl>
    </Border>
Value Converter:
public sealed class ChartIndexToIdConverter : IValueConverter
{
    private readonly static Dictionary<int, Tuple<int, string[]>> _lookup = new Dictionary<int, Tuple<int, string[]>>();
    private readonly static Random _rnd = new Random();

    public static int Register(IControlChart chart)
    {
        var key = _rnd.Next();
        while (_lookup.ContainsKey(key)) key = _rnd.Next();
        _lookup.Add(key, new Tuple<int, string[]>(chart.First().Index, chart.Select(d => d.Id).ToArray()));
        return key;
    }

    public object Convert(object value, Type targetType, object parameter, CultureInfo culture)
    {
        if (value == null) throw new ArgumentNullException("value");
        if (parameter == null) throw new ArgumentNullException("parameter");
        var tuple = _lookup[(int)parameter];
        return tuple.Item2[(int)value - tuple.Item1];
    }
}
- Thomas Kriewall asked 9 years ago
- You must login to post comments
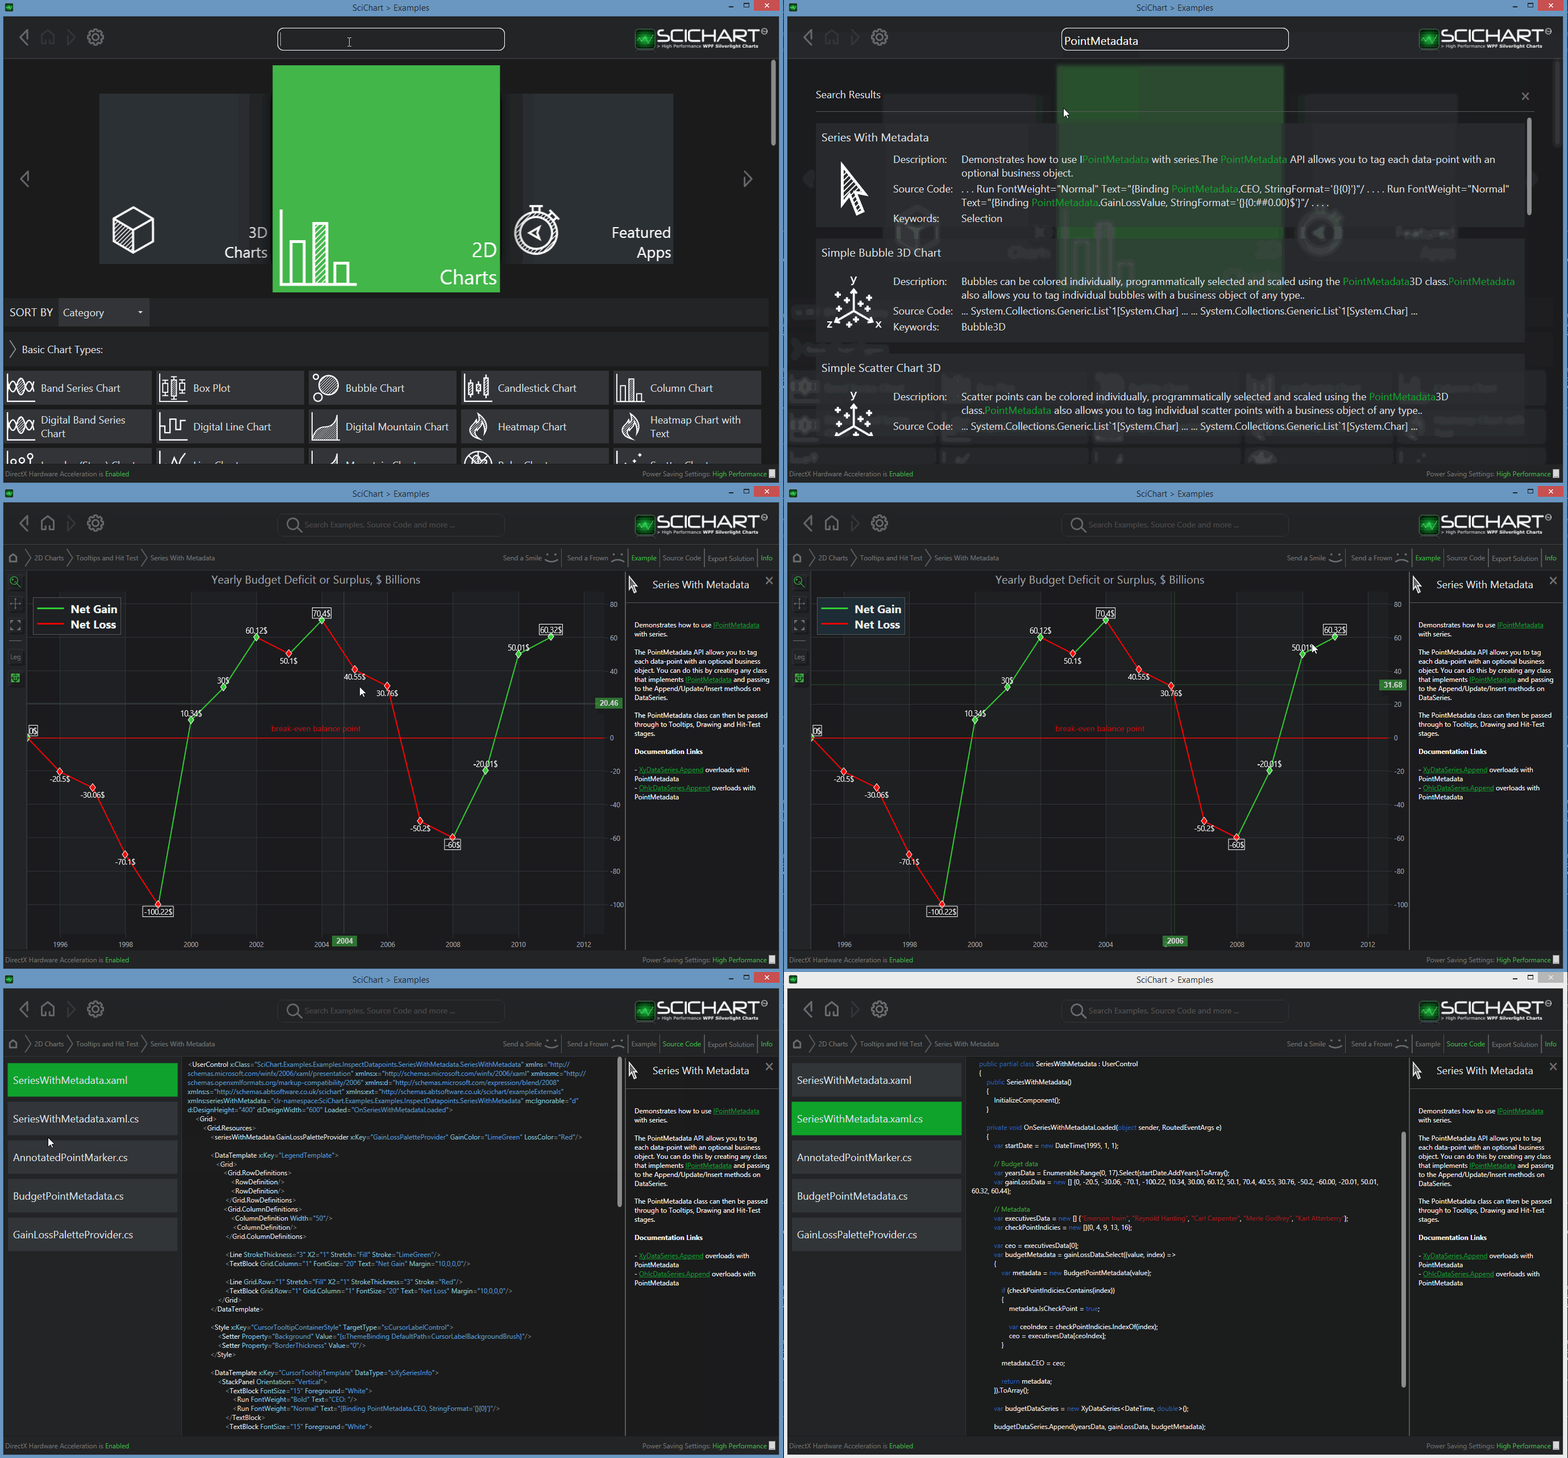
UPDATE: SciChart v4 Now Supports PointMetadata Natively
You will be pleased to know, in SciChart v4 we have included the new PointMetadata API natively.
This allows you to tag any data-point with a class of your choice (implementing IPointMetadata interface) and pass through to tooltips and hit-test.
Demo
There is a full example in our SciChart v4 WPF Examples Suite -> Tooltips and Hit Test -> Series with Metadata

Example
// Create the IPointMetadata derived type
public class MyMetadata : IPointMetadata
{
   public event PropertyChangedEventHandler PropertyChanged;

   public MyMetadata(string label)
   {
      this.Label = label;
   }

   public bool IsSelected { get; set; }
   public string Label { get; set; }
}

// Append it to DataSeries
void Foo()
{
   var xyDataSeries = new XyDataSeries<double>();
   xyDataSeries.Append(0, 10, new MyMetadata("Hello"));
   xyDataSeries.Append(1, 20, null);
   xyDataSeries.Append(2, 30, new MyMetadata("World!"));
}
Throughout SciChart v4 you can now bind to PointMetadata in tooltips, get PointMetadata in PaletteProviders and access via the DataSeries.Metadata column.
Best regards,
Andrew
- Andrew Burnett-Thompson answered 8 years ago
- You must login to post comments
Hi Thomas,
Thanks for your request. There is another way to achieve this in SciChart. It is possible to replace the object which is used as the DataContext of a tooltip label. A little of customization of RenderableSeries is required though.
So to implement this, you should override the GetSeriesInfo method of RenderableSeries. Inside you can get the desired value from the Dictionary based on ZValue, and pass it to a custom SeriesInfo. This object is going to become the DataContext for a label, so you will be able to bind to it in XAML.
Here is a basic example:
public class LineSeriesEx : FastLineRenderableSeries
{
    public override SeriesInfo GetSeriesInfo(HitTestInfo hitTestInfo)
    { // Obtain the desired value here
        var myValue = GetValueFromDictionary(hitTestInfo.ZValue);

       // Return the SeriesInfo object, which is going to be label's DataContext
        return new XyzSeriesInfoEx(this, hitTestInfo, myValue);
    }
}

public class XyzSeriesInfoEx : XyzSeriesInfo
{
    public XyzSeriesInfoEx(IRenderableSeries rSeries, HitTestInfo hitTestInfo, object myValue)
        : base(rSeries, hitTestInfo)
    {
        MyValue = myValue;
    }

    public object MyValue { get; private set; }
}
Please let us know if this approach is suitable for you,
Best regards,
Yuriy
- Guest answered 9 years ago
- last edited 9 years ago
 Hi Yuriy - this proposal worked great. Thanks for the helpful suggestion!
-
Hi Thomas, I'm glad it does the trick! ^^ Feel free to ask in case of any further questions. And could you mark this post as an accepted answer please?
- You must login to post comments
Please login first to submit.
