Hi
I have a XyScatterRenderableSeries series with point markers.
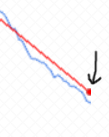
As show on the attached image – the point markers are clipped at the edge – even though the data point is within the visible range.
I do not want to expand the visible range.
Is there a way to achieve this?
/Flemming
- You must login to post comments
If the PointMarker is on the exact edge of the VisibleRange it will get clipped I’m afraid. This is because this is the edge of the RenderSurface in SciChart and we cannot draw outside this area.
Is this the case? (Data-point X value is equal to XAxis.VisibleRange.Max?)
Best regards
Andrew
- Andrew Burnett-Thompson answered 5 years ago
 Hi Andrew Yes – the data point x value is equal to XAxis.VisibleRange.Max. But even if it was one of the data points before this point – it would (depending on point marker size) get clipped. /Flemming
 Hi Fleming, it’s the same reason. We cannot draw outside the rectangle of the central chart area.
- You must login to post comments
Please login first to submit.

