Hello,
I’ve been trying to follow the FAQ on positioning columns between data values but instead of using a FastMountainRenderableSeries, I’ve been using a StackedMountainRenderableSeries.
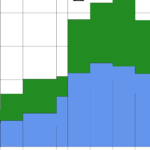
Ticks are being drawn correctly. The problem arises when it’s drawing the lines that separate each column.
If I have two series, the lines for the first one are being drawn, but the second line drawing is overwriting the first lines because the position coordinates are incorrect. I understand that in order to solve this issue I would have to aggregate the lengths of each column to the next series and then calculate the drawing position from there, but as far as I’ve been looking, the series do now know anything between each other.
Is there a work-around or a place where I can calculate this aggregation and have it sent to each stacked series?
I attach an image with the issue.
Thank you.
Regards,
Sebastian
- You must login to post comments
Hi Sebastian,
Thank you for the additional information. Concerning how to find accumulated values, there is a property in the StackedMountainRenderableSeries class called Wrapper of type IStackedMountainsWrapper. There is the AccumulateYValueAtX(IRendrableSeries, Index) method, which should do this. It returns a pair of values for a RenderableSeries, Tuple<double, double>(top, bottom), which are aggregated of all the “lower” series.
You will need to convert these to pixels then using the Coordinate Transformation API.
Please let us know if you managed to achieve the desired.
Best regards,
Yuriy
- Yuriy Zadereckiy answered 8 years ago
 Thank you very much Yuriy! I found a work-around what it was horrible. This solution is much better.
- You must login to post comments
Hi Sebastian,
Thanks for your request. May I ask you for some clarifications? Could you please give a link to that FAQ you mentioned in your post?
Could you also describe your use-case a bit more? It isn’t clear what you want to achieve, and what the overlapping series you use. Could you please give clarify this as well?
- Yuriy Zadereckiy answered 8 years ago
- You must login to post comments
Hello Yuriy.
The FAQ I mention can be found here: https://www.scichart.com/questions/question/faq-how-to-position-columns-between-data-values-instead-of-centered-on-data-values#sabai-inline-nav
I’m looking to create a Stacked Histogram, but where the range values are positioned between the columns.
The Histogram example doesn’t provide this functionality, so I found the FAQ and set to use a MountainSeries. For a single series, it works great. When I want to use Stacked series, the line that is being drawn between each “column” is not working correctly, mainly because the ZeroLineY is different for the second series (since each starting column is at the end of the height of the first column).
The problem is that the series do not know about each other, so I cannot calculate the new position of the line to draw based on the previous series’ heights.
- Sebastian de Ugarriza answered 8 years ago
- You must login to post comments
Please login first to submit.

