I’m trying to create a chart where the visible range is scrolling “window” that advances ahead of the most recent data point when the data hits the edge so that the line is always moving from the center of the chart towards the edge.
Say we have data coming in once a second, we want the window to be 60 seconds wide and advance in increments of 30 seconds. In SciChart terms, we would begin with a data range of 0-0 and a visible range of 0-60. The line will start at the left edge of the chart and, as points come in, advance towards the right edge. When we get a point at t=60, we will programmatically advance the visible range by our increment so that we have a data range of 0-60 and a visible range of 30-90. The line will now be advancing from the middle of the chart to the right edge. When we hit t=90, we will advance the visible range again so data range = 0-90, visible range = 60-120. Again the line will advance from the center of the chart to the edge. And so on.
My current problem is the scrollbar. If I have a data range of 0-90 and a visible range of 60-120, the total extent of the chart as far as a normal viewer is concerned is 0-120. The scrollbar should reflect that, and the bit of the scrollbar that indicates the visible section should take up half its total width (0-60 being in the past and 60-120 being visible). Instead, the scrollbar is sized as though 0-60 is in the past and 60-90 is visible. Touching the scrollbar at all will, in fact, set the visible range to 60-90, re-rendering the chart and eliminating our buffer of visible space to the right. My question is how do I fix this behavior so that the scrollbar is aware of the “real” range of the chart which is neither data range nor visible range but a combination of the two?

- Mike Bennett asked 9 years ago
- You must login to post comments
Hi Mike,
Following the discussion above, I believe I know the cause of the issue and have a solution for you.
Summary of the problem
The issue is that you want a scrolling chart (rather like the WPF Examples Suite -> ECG sample) but want the SciChartScrollbar to behave in a rational way. At the moment the SciChartScrollbar maximum size is limited to the size of the data, not the size of the current viewport + data.
Reason for the problem
The reason for this is the SciChartScrollBar takes the parent axis DataRange and VisibleRange as inputs to determine its size and position.
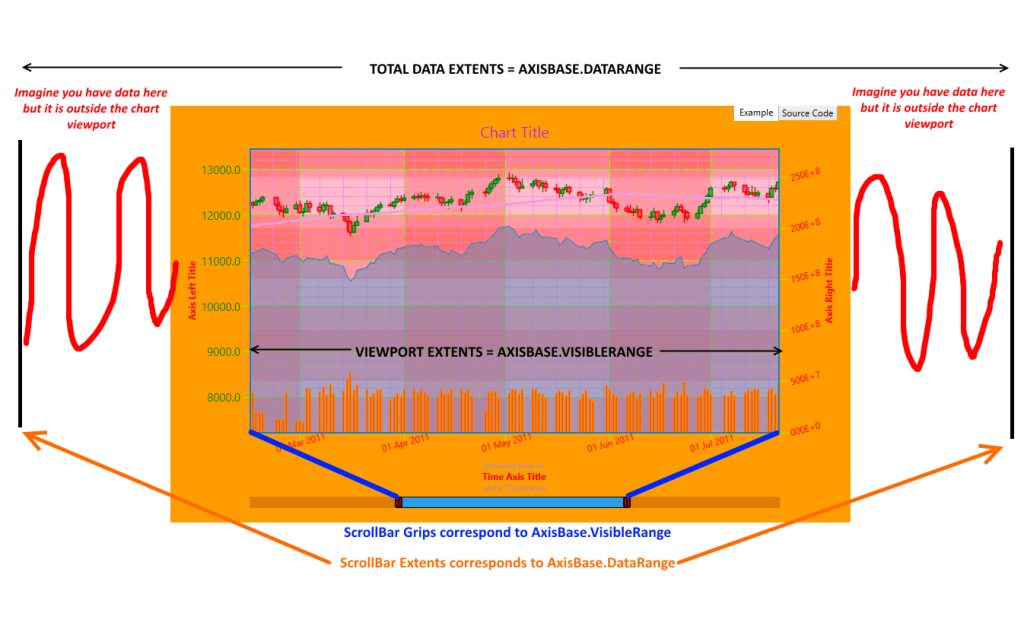
DataRange: is calculated as the Union of DataSeries.XRange for all DataSeries on that axis
VisibleRange: is the current AxisBase.VisibleRange
The solution
The solution for this should be simple. If you override the Axis.DataRange property it will force the Scrollbar to expand it’s total available size. To do this you will need to inherit from an axis type and override the DataRange property, e.g.
public class CustomAxis : NumericAxis
{
    protected override IRange CalculateDataRange()
    {
          // Provide your own custom implementation here
          return base.CalculateDataRange();
    }

    // e.g. could add a dependency property VmDataRange and bind it to viewmodel
    // then just return that. That would allow you to fully control DataRange from a viewmodel
}
Let me know if this solves the problem,
Best regards,
Andrew
- Andrew Burnett-Thompson answered 9 years ago
 Thanks. I'll give that a shot.
- I tried it and it essentially creates a different problem. If the data range is from 0 to 20 and the overridden viewport range from 0 to 100, the chart will only display data from 0 to 20, the axis will go from 0 on the left to 20 on the right, but the scrollbar and the scrollbar alone will act as if the data is from 0 to 100. The desired behavior here would the for the chart and the axis to show from 0 to 100 leaving a blank range beyond the available data.
- You must login to post comments
Please login first to submit.
