————————————————————————————————————————————–
The whole issue emerged as result of negative values input in Logarithmic scale mode.
Many thanks to ABT’s support for pointing out the source of the issue!
—————————————————————————————————————————-
Hi,
Our company owns a license for SciChart.
While trying to implement logarithmic axis behavior in Real time FIFO chart, we have encountered several problems (v2.2.3322 and also v2.2.3441)
In attempt to demonstrate the issues we are facing,
I’ve done some minor modifications to the code to RealtimeFifoChartView (both .xaml and .cs files) in the Abt.Controls.SciChart.Example solution.
(The aforementioned files can be found in the attached zip archive).
Data Set Initialization (in: RealtimeFifoChartView.cs)
The data is loaded from a .csv file named “data.csv” (can be found in the attached zip archive),
The file represents a DataSet.
Y-Axis values are in the range of (1.0E-12, 1.0E-1).
New InitChart(…) Method, in row: 172
public void InitChart()
{
    var reader = new StreamReader(File.OpenRead(@"C:\data.csv"));
    var xValues = new List<double>();
    var yValues = new List<double>();
    while (!reader.EndOfStream)
        {
                var line = reader.ReadLine();
                if (line != null)
                {
                        var values = line.Split(',');
                        xValues.Add(Convert.ToDateTime(values[0]).ToFileTime());
                        yValues.Add(Convert.ToDouble(values[1]));
                }
        }
        series0.Append(xValues, yValues);
}
New InitChart(…) method invoked from OnExampleEnter(…) method, in row: 168
public void OnExampleEnter()
{
        ResetButton_Click(this, null);
        InitChart();
        _startDelegate = TimedMethod.Invoke(() => StartButton_Click(this, null)).After(500).Go();
}
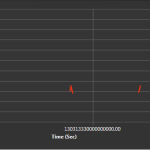
The chart generated before making further changes:
RT_FIFO_NumericAxis.png (attachment #3 file)
Issue #1:
In RealtimeFifoChartView.xaml, row: 39
After Changing NumericAxis to LogarithmicNumericAxis, Chart isn’t scaled correctly (AutoRanged)
(Y values range is (1.0E-12, 1.0E-1), and AutoRange=”Always”) and data isn’t visible.
RT_FIFO_LogarithmicAxis.png (attachment #2)
Issue #2:
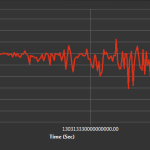
In attempt to bypass the scaling (AutoRange) issue, I’ve tried controlling the VisibleRange myself, however the resulting chart is distorted and most of the date is missing.
In RealtimeFifoChartView.xaml, row: 39
VisibleRange=”1.0E-12, 1.0E-1″ Property added to Chart declaration:
RT_FIFO_LogarithmicAxis_CustomVisbleRange.png (attachment #1)
I would be grateful if you could tell me if I’m doing something wrong, or otherwise suggest another solution to present the data in “data.csv” in a Y-Axis Logarithmic scale.
Best Regards.
Cherp Mark.
- Mark asked 10 years ago
- last edited 1 year ago
- You must login to post comments
Hi Mark,
The data in the attached .csv file contains negative values. Currently we don’t support rendering negative data by the logarithmic axis. However, we are always open to suggestions in order to make SciChart better and to cover most use cases, so could I ask you, what is the desired behavior and expected look? Which numbers should the axis show? Maybe you can post some screenshots or point us to some chart samples…
We appreciate your help very much.
Best regards,
Yuriy
- Yuriy Zadereckiy answered 10 years ago
 Hello Yuri, I'm also using Logarithmic Y-Axis (for unsigned integer values in my case) and have to either drop points with a zero value (time consuming) or change them to 1 (and maintain the old value in case the user switches back to a linear scale) My suggestion would be to have the logarithmic plot skip invalid (zero and negative) data points completely Kind Regards (A different) Mark
 Thanks for the suggestion, Mark! We will consider it, but I'm not sure it is a quite convenient way, because such a behavior is not obvious and expected, so can mislead users who have incorrect data or some expectations about the output result. Anyway, thank you for the idea, please, feel free to email us or post on the forums any suggestions or remarks - we are glad to receive feedback from the users and ready to take into account their opinions and thoughts about the ways of improving SciChart and making the API more user friendly!
 Hi Yuriy, Today I also ran into this problem. Would it be a solution to simply treat a negative value as a positive value, determine it's position on the logarithmic axis and then invert it on the other axis? So if a logarithmic y axis goes like 10%, 100%, 1000%, you would get the values -10%, -100%, -1000% below the x-axis and the negative values would be plotted there accordingly. Hope this makes sense to you. If not, let me know and I'll try to come up with a better explanation. Regards, Ruud
-
Hi Ruud, could you please please attach a screenshot showing the desired behavior? You could create a new thread or a ticket at http://support.scichart.com/ . Thanks, Yuriy
- You must login to post comments
Any progress on this?
I have the same problem with negative values when displayed with a logarithmic axis.
The solution suggested by Ruud sounds perfect to me.
- Wessel de Vries answered 1 year ago
- last edited 1 year ago
 Progress? This is a ten years old forum post :D we do have some detection now in SciChart WPF to avoid negative values if they exist. There is also a specific NegativeLogarithmicAxis type to handle negative numbers only on a log scale https://www.scichart.com/documentation/win/current/SciChart.Charting~SciChart.Charting.Visuals.Axes.LogarithmicAxis.NegativeLogarithmicAxis_members.html. Please open a new forum question if you have issues or questions. Thanks!
 I asked this here because I’ve been searching vigorously for logarithmic axis problems, since I also have them. Not only with negative values, but also with general serie drawing and tooltips. Was hoping you would implement something like Ruud’s suggestion. I’ve already opened a support ticket for the problems I experienced.
- You must login to post comments
Please login first to submit.


