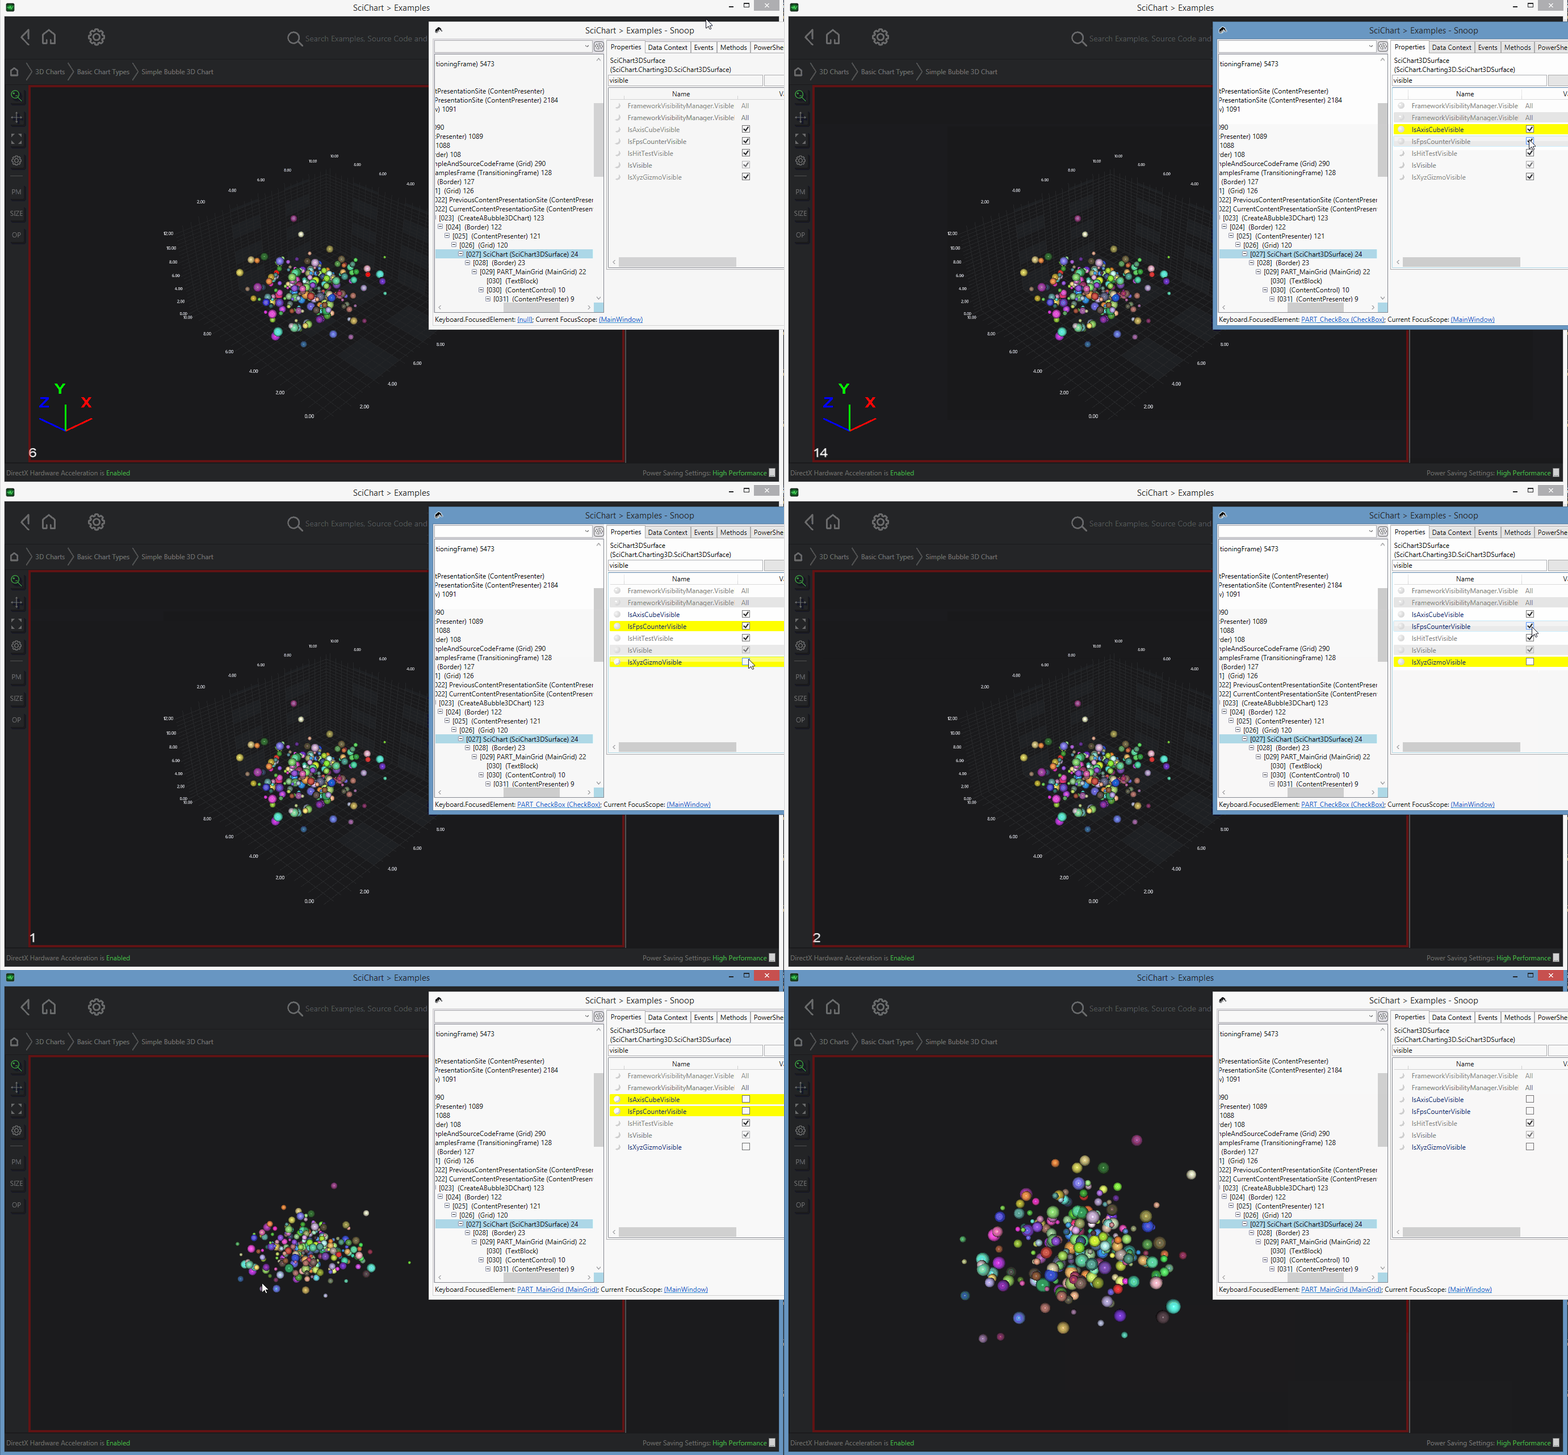
I’m using the shiny new 3D capabilities and wanted to know if the X(red), Y(green), Z(blue) axis orientation indicator can be removed from a chart.
Looked for a property on the SciChart3DSurface and Camera3D but didn’t find anything.
Is it a “always present in demo” thing?
Thanks
- Mark Attwood asked 8 years ago
- You must login to post comments
Hi Mark,
You’ll be pleased to know we have added this featurette to v4.0.3.8065, which is available from our NuGet Feed.
Three properties have been added which help configure some of the static parts of the 3D scene. These include:
-
SciChart3DSurface.IsAxisCubeVisible: Shows / Hides the Axis Cube
-
SciChart3DSurface.IsFpsCounterVisible: Shows / Hides the FPS (Refresh rate)
-
SciChart3DSurface.IsXyzGizmoVisible: Shows / Hides the XYZ Gizmo

In later versions of SciChart3D we plan to make these more accessible / configurable by allowing developers to manipulate the 3D Scene in code. The foundation is there for a fully customizable 3D Engine in WPF but we haven’t quite exposed all the end-points yet!
Thanks for the feature request!
Best regards,
Andrew
- Andrew Burnett-Thompson answered 8 years ago
- You must login to post comments
Hi Andrew,
I’m shocked, shocked I tell you.
However that is offset by the name “XYZ Gizmo” being waaaay better than “XYZ Orientation Indicator” and that, combined with your intention to allow it to be attached/detached, brings forgiveness.
Many Thanks
Mark
- Mark Attwood answered 8 years ago
 It is a good name :) :)
- You must login to post comments
Hi Mark,
You will be very surprised to learn that the XYZ orientation indicator (or XYZ Gizmo as we call it) is currently hard-coded in C++ deep in the belly of SciChart 3D.
What a shocker! That’s not right from the SciChart Team.
I have however created a task to extract it into a helper class which can be attached/detached.
Best regards,
Andrew
- Andrew Burnett-Thompson answered 8 years ago
- You must login to post comments
Please login first to submit.
