Hello everybody! I’m working with FastMountainrenderableSeries, I need to paint them particularly:
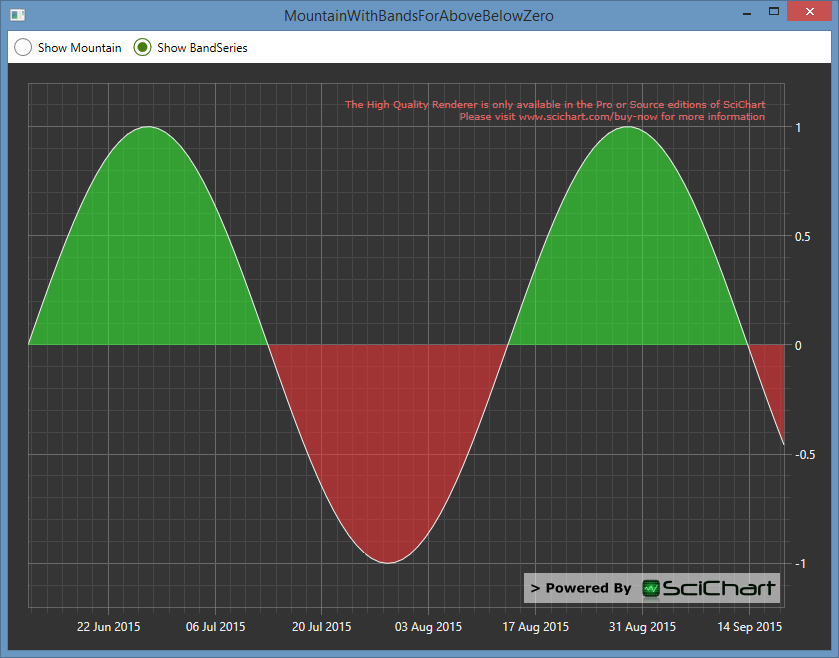
I have got an annotation, that can be moved, and area of renderable series. The area, that is above the annotaion, must be painted with one color, and area below the annotation must be painted with another (see image 1). I know, that it can be done with FastBandRenderableSeries, but I don’t need to have two series. Is there any way to do this with FastMountainSeries or FastBandRenderableSeries and annotation, without extra auxiliary renderable series ?
Thanks in advance.

- Egor asked 9 years ago
- You must login to post comments
Actually, Yuriy is right about PaletteProvider and FastMountainRenderableSeries, but also FastBandRenderableSeries is perfect for this.
If you create an XyyDataSeries, and supply X,Y0 equal to your data and Y1=0.0 at all points, it will then draw a perfect polygon above and below the zero line.
Here’s the example code
Xaml
<Window x:Class="Abt.Controls.SciChart.Wpf.TestSuite.TestCases.MountainWithBandsForAboveBelowZero"
        xmlns="http://schemas.microsoft.com/winfx/2006/xaml/presentation"
        xmlns:x="http://schemas.microsoft.com/winfx/2006/xaml"
        xmlns:s="http://schemas.abtsoftware.co.uk/scichart"
        Title="MountainWithBandsForAboveBelowZero" Height="300" Width="300">
    <Grid>
        <Grid.RowDefinitions>
            <RowDefinition Height="32"/>
            <RowDefinition Height="*"/>
        </Grid.RowDefinitions>

        <StackPanel Orientation="Horizontal">
            <RadioButton Margin="6" IsChecked="{Binding ElementName=mountainSeries, Path=IsVisible, Mode=TwoWay}" Content="Show Mountain"/>
            <RadioButton Margin="6" IsChecked="{Binding ElementName=bandSeries, Path=IsVisible, Mode=TwoWay}" Content="Show BandSeries"/>
        </StackPanel>

        <s:SciChartSurface Grid.Row="1">
            <s:SciChartSurface.RenderSurface>
                <s:HighQualityRenderSurface/>
            </s:SciChartSurface.RenderSurface>

            <s:SciChartSurface.RenderableSeries>
                <s:FastMountainRenderableSeries x:Name="mountainSeries" IsVisible="False" SeriesColor="WhiteSmoke" AreaBrush="#8833FF33"/>
                <s:FastBandRenderableSeries x:Name="bandSeries" SeriesColor="WhiteSmoke" Series1Color="Transparent" BandUpColor="#8833FF33" BandDownColor="#88FF3333"/>
            </s:SciChartSurface.RenderableSeries>
            <s:SciChartSurface.XAxis>
                <s:DateTimeAxis/>
            </s:SciChartSurface.XAxis>
            <s:SciChartSurface.YAxis>
                <s:NumericAxis GrowBy="0.1, 0.1"/>
            </s:SciChartSurface.YAxis>

        </s:SciChartSurface>
    </Grid>
</Window>
Code behind
using System;
using System.Windows;
using Abt.Controls.SciChart.Model.DataSeries;

namespace Abt.Controls.SciChart.Wpf.TestSuite.TestCases
{
    public partial class MountainWithBandsForAboveBelowZero : Window
    {
        public MountainWithBandsForAboveBelowZero()
        {
            InitializeComponent();

            var xyyData = new XyyDataSeries<DateTime, double>();

            var startTime = DateTime.Now;
            for (int i = 0; i < 100; i++)
            {
                var x = startTime.AddDays(i);
                var y = Math.Sin(i*0.1);

                // Append X=Date, Y=Sinewave, Y1=0.0
                // the y1 value is used by FastBandRenderebleSeries as a threshold to change band colour
                xyyData.Append(x, y, 0.0);
            }

            mountainSeries.DataSeries = xyyData; // Note MountainSeries can consume Xyy or Xy data
            bandSeries.DataSeries = xyyData; // Note Band Series requires Xyy Data
        }
    }
}
Here’s the Result
- Andrew Burnett-Thompson answered 9 years ago
 Hello, thank you for your answer! One more question: is there any way to make renderable series move with drag and drop like annotation?
 Hi Egor, you can write this functionality in by using our custom ChartModifier API. See this article on Selecting and Dragging a series: http://support.scichart.com/index.php?/Knowledgebase/Article/View/17237/32/custom-chartmodifiers---part-3---custom-select-and-drag-a-series Hope this helps!
- Ok. Thank you! I'll try two methods to find the solution
- You must login to post comments
Hi Egor,
Thank you for inquiring us. As to your question, it is possible to achieve using the PaletteProvider feature. Please take a look at this article on the topic from our Knowledgebase. Also you could find an example in our online demo.
Hope this helps,
Best regards,
Yuriy
- Guest answered 9 years ago
- last edited 6 years ago
- Hello, thak you for the fast answer. I've already used the PalleteProvider feature in my work, but there is a little trouble (I've attached image , what I have now using this method, and what I must achieve). Need I bind ZeroLineY to annotaion coordinate or there is another way to achive the expected image?
-
Yes, binding the ZeroLineY property should do the trick. This seems to be the easiest way. Have you met any complications with it?
- No, I haven't, but I wasn't sure if it was a good approach. Thank you for your advice. I'll write about the result later
- This method works, thank you! But there is one more question: if I want to paint lineseries and area brush with different colors, I need to rewrite draw part in InternalDraw method?
-
Hi Egor, no, you need not. There is the SeriesColor property, which allows you to specify the color of the outline of MountainSeries, and the AreaColor property, which allows you to specify the color of the polygon below the mountain line.
- You must login to post comments
Attached imaged to Yuriy’s comment:

- Egor answered 9 years ago
- You must login to post comments
Please login first to submit.
