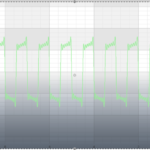
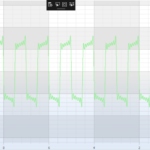
Running off of visual studio 2017. Slightly changed one of the line examples. Here is my source code.
// *************************************************************************************
// SCICHART® Copyright SciChart Ltd. 2011-2017. All rights reserved.
//
// Web: http://www.scichart.com
// Support: [email protected]
// Sales: [email protected]
//
// LineChartExampleView.xaml.cs is part of the SCICHART® Examples. Permission is hereby granted
// to modify, create derivative works, distribute and publish any part of this source
// code whether for commercial, private or personal use.
//
// The SCICHART® examples are distributed in the hope that they will be useful, but
// without any warranty. It is provided “AS IS” without warranty of any kind, either
// expressed or implied.
// *************************************************************************************
using System;
using System.Collections.Generic;
using System.Collections.ObjectModel;
using System.ComponentModel;
using System.Globalization;
using System.Linq;
using System.Windows;
using System.Windows.Controls;
using System.Windows.Data;
using System.Windows.Media;
using SciChart.Charting.Model.DataSeries;
using SciChart.Charting.Visuals.RenderableSeries;
using SciChart.Data.Model;
using SciChart.Examples.ExternalDependencies.Data;
using SciChart.Charting;
namespace SciChart.Examples.Examples.CreateSimpleChart
{
public partial class LineChartExampleView : UserControl
{
public LineChartExampleView()
{
InitializeComponent();
    }

    private void LineChartExampleView_OnLoaded(object sender, RoutedEventArgs e)
    {
        // Create a DataSeries of type X=double, Y=double
        var dataSeries = new XyDataSeries<double, double>();

        lineRenderSeries.DataSeries = dataSeries;

        var data = DataManager.Instance.GetFourierSeries(1.0, 0.1);

        // Append data to series. SciChart automatically redraws
        ThemeManager.SetTheme(this, "Chrome");
        dataSeries.Append(data.XData, data.YData);

        sciChart.ZoomExtents();
    }

    private void Button_Click(object sender, RoutedEventArgs e)
    {
        Clipboard.SetImage(this.sciChart.ExportToBitmapSource());
    }
}
}
And the xaml
<UserControl.Resources>
    <ResourceDictionary>
    </ResourceDictionary>
</UserControl.Resources>

<Grid>
    <Grid.ColumnDefinitions>
        <ColumnDefinition Width="Auto" />
        <ColumnDefinition Width="*" />
    </Grid.ColumnDefinitions>

    <!--  The SciChartInteractionToolbar adds zoom, pan, zoom extents and rotate functionality  -->
    <!--  to the chart and is included for example purposes.  -->
    <!--  If you wish to know how to zoom and pan a chart then do a search for Zoom Pan in the Examples suite!  -->
    <Button Foreground="AntiqueWhite"  Visibility="Visible" Click="Button_Click" MinWidth="100" MinHeight="40">COPY</Button>


    <!--  Create the chart surface  -->
    <s:SciChartSurface Name="sciChart"
                       Grid.Column="1">

        <!--  Declare RenderableSeries  -->
        <s:SciChartSurface.RenderableSeries>
            <s:FastLineRenderableSeries x:Name="lineRenderSeries"
                                        Stroke="#FF99EE99"
                                        StrokeThickness="2"/>
        </s:SciChartSurface.RenderableSeries>

        <!--  Create an X Axis with Growby  -->
        <s:SciChartSurface.XAxis>
            <s:NumericAxis DrawMajorBands="True"
                           FlipCoordinates="True"
                           GrowBy="0.1, 0.1"
                           ScientificNotation="None"
                           TextFormatting="#.############" />
        </s:SciChartSurface.XAxis>

        <!--  Create a Y Axis with Growby. Optional bands give a cool look and feel for minimal performance impact  -->
        <s:SciChartSurface.YAxis>
            <s:NumericAxis DrawMajorBands="True" GrowBy="0.5, 0.5" />
        </s:SciChartSurface.YAxis>

    </s:SciChartSurface>
</Grid>
All I did was remove the toolbar and a dd a button that copied the image to the clipboard. Yet Somehow the result of what you see while running and what you get from the clipboard are not the same. The lower half of the image you get by rendering to memory is clearly darker. I tried uploading them but could not.
- You must login to post comments
Both pictures
- You must login to post comments
Hello Jean Francois Valero Hernandez,
I’ve investigated your problem and here is some results:
https://monosnap.com/file/BrOyVUv1kjMbVDHBiLbZgAWOzvcZof
i have got the same look in an exported image and in a real chart with using “Chrome” theme.
that lower color comes form Chrome theme LineGrdaient with x:Key = SciChartBackground.
so it gets the correct image, maybe you’ve customized somethow your real chart? or theme ?
- Nazariy Pelyushkevych answered 6 years ago
- You must login to post comments
I know the answer to this. Chrome theme is semi-transparent hence the actual image in the application will show the background (aka white) whereas the exported PNG will be semi-transparent and look darker.
To fix this you can change the background of the chart to a gradient brush of your choice then export. Or, do some post-processing with the PNG to overlay the exported image on a white background.
- Andrew Burnett-Thompson answered 6 years ago
- You must login to post comments
Please login first to submit.


