I am trying disable AutoRange=”Always” property for SciChartOverview. As for now I see only one way, change SciChartOverview template. But VS generate wrong template for SciChartOverview, chart line gone, after template replacement (I am using “Edit Template” -> “Edit Copy” feature from VS designer mouse context menu )
Here is template:
<s:SciChartOverview.Resources>
    <Style TargetType="{x:Type s:SciChartOverview}">
        <Setter Property="FontSize" Value="20"/>
        <Setter Property="FontWeight" Value="Normal"/>
        <Setter Property="Background" Value="{Binding (s:ThemeManager.Theme), Mode=OneWay, RelativeSource={RelativeSource Self}}"/>
        <Setter Property="Foreground" Value="{Binding (s:ThemeManager.Theme), Mode=OneWay, RelativeSource={RelativeSource Self}}"/>
        <Setter Property="Padding" Value="0"/>
        <Setter Property="Fill" Value="{Binding (s:ThemeManager.Theme), Mode=OneWay, RelativeSource={RelativeSource Self}}"/>
        <Setter Property="Stroke" Value="{Binding (s:ThemeManager.Theme), Mode=OneWay, RelativeSource={RelativeSource Self}}"/>
        <Setter Property="SelectedRange" Value="{Binding Axis.VisibleRange, Mode=TwoWay, RelativeSource={RelativeSource Self}}"/>
        <Setter Property="RenderableSeriesStyle">
            <Setter.Value>
                <Style TargetType="{x:Type s:FastMountainRenderableSeries}">
                    <Setter Property="Fill" Value="{Binding Fill}"/>
                    <Setter Property="DataSeries" Value="{Binding DataSeries}"/>
                    <Setter Property="Stroke" Value="{Binding Stroke}"/>
                </Style>
            </Setter.Value>
        </Setter>
        <Setter Property="RenderableSeriesType" Value="{x:Type s:FastMountainRenderableSeries}"/>
        <Setter Property="ScrollbarStyle">
            <Setter.Value>
                <Style TargetType="{x:Type s:SciChartScrollbar}">
                    <Setter Property="Orientation" Value="Horizontal"/>
                    <Setter Property="GripsLength" Value="25"/>
                    <Setter Property="Background" Value="Transparent"/>
                    <Setter Property="ViewportStyle">
                        <Setter.Value>
                            <Style TargetType="{x:Type Control}">
                                <Setter Property="Opacity" Value="0"/>
                            </Style>
                        </Setter.Value>
                    </Setter>
                    <Setter Property="NonSelectedAreaStyle">
                        <Setter.Value>
                            <Style TargetType="{x:Type Path}">
                                <Setter Property="Fill" Value="{Binding (s:ThemeManager.Theme), Mode=OneWay, RelativeSource={RelativeSource Self}}"/>
                            </Style>
                        </Setter.Value>
                    </Setter>
                </Style>
            </Setter.Value>
        </Setter>
        <Setter Property="Template">
            <Setter.Value>
                <ControlTemplate TargetType="{x:Type s:SciChartOverview}">
                    <Grid x:Name="PART_Container">
                        <s:SciChartSurface x:Name="PART_BackgroundSurface" AnimateZoomExtentsCommand="" BorderThickness="0" Background="{TemplateBinding Background}" DebugWhyDoesntSciChartRender="False" Foreground="{TemplateBinding Foreground}" FontWeight="{TemplateBinding FontWeight}" FontSize="{TemplateBinding FontSize}" Padding="{TemplateBinding Padding}" RenderPriority="Normal" UseLayoutRounding="True" ZoomExtentsCommand="">
                            <s:SciChartSurface.ViewportManager>
                                <s:DefaultViewportManager>
                                    <s:DefaultViewportManager.Services>
                                        <Utility:ServiceContainer/>
                                    </s:DefaultViewportManager.Services>
                                </s:DefaultViewportManager>
                            </s:SciChartSurface.ViewportManager>
                            <s:SciChartSurface.YAxis>
                                <s:NumericAxis AutoRange="Always" DrawMajorGridLines="False" DrawMajorBands="False" DrawMinorGridLines="False" IsPrimaryAxis="True" TextFormatting="###E+0" UseLayoutRounding="True" Visibility="Collapsed">
                                    <s:NumericAxis.Services>
                                        <Utility:ServiceContainer/>
                                    </s:NumericAxis.Services>
                                    <s:NumericAxis.TickProvider>
                                        <s:NumericTickProvider/>
                                    </s:NumericAxis.TickProvider>
                                    <s:NumericAxis.TickCoordinatesProvider>
                                        <s:DefaultTickCoordinatesProvider/>
                                    </s:NumericAxis.TickCoordinatesProvider>
                                </s:NumericAxis>
                            </s:SciChartSurface.YAxis>
                            <s:SciChartSurface.YAxes>
                                <s:NumericAxis AutoRange="Always" DrawMajorGridLines="False" DrawMajorBands="False" DrawMinorGridLines="False" IsPrimaryAxis="True" TextFormatting="###E+0" UseLayoutRounding="True" Visibility="Collapsed">
                                    <s:NumericAxis.Services>
                                        <Utility:ServiceContainer/>
                                    </s:NumericAxis.Services>
                                    <s:NumericAxis.TickProvider>
                                        <s:NumericTickProvider/>
                                    </s:NumericAxis.TickProvider>
                                    <s:NumericAxis.TickCoordinatesProvider>
                                        <s:DefaultTickCoordinatesProvider/>
                                    </s:NumericAxis.TickCoordinatesProvider>
                                </s:NumericAxis>
                            </s:SciChartSurface.YAxes>
                        </s:SciChartSurface>
                        <s:SciChartScrollbar x:Name="PART_Scrollbar" Axis="{TemplateBinding Axis}" Height="{Binding ActualHeight, ElementName=PART_BackgroundSurface}" Style="{TemplateBinding ScrollbarStyle}"/>
                    </Grid>
                </ControlTemplate>
            </Setter.Value>
        </Setter>
    </Style>
</s:SciChartOverview.Resources>
The main task for me, set fixed VisibleRange for YAxis.
- Konstantin Shapovalov asked 4 years ago
- last edited 4 years ago
- You must login to post comments
Hi there,
This question is badly formatted and very difficult to see what you have tried to achieve the effect you want.
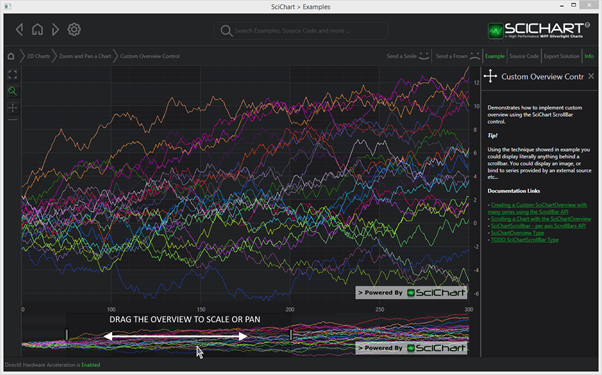
However, I understand you want to customise SciChartOverview’s chart behind the scrollbar. Did you know you can customise this infinitely using this technique?
https://www.scichart.com/example/wpf-chart-example-custom-overview-control/
See also the Overview documentation which goes into greater detail.
https://www.scichart.com/documentation/v5.x/SciChartOverview.html
Try this instead, it is more flexible and the best way to achieve something non-standard.
Best regards,
Andrew
- Andrew Burnett-Thompson answered 4 years ago
 I was try this way, but it much more complicated. I need change only one property value.
 I understand, but either you use my method or re-template. Both are complex (because you are changing one property value … inside a control). If you have found a solution with re-templating then that’s great!
- You must login to post comments
Here is working template for my case:
<s:SciChartOverview
        Grid.Row="1"
        Grid.Column="0"
        Margin="5,2"
        DataSeries="{Binding RenderableSeries[0].DataSeries, ElementName=sciChartSurface}"
        Fill="Transparent"
        ParentSurface="{Binding ElementName=sciChartSurface}"
        SelectedRange="{Binding XAxis.VisibleRange, ElementName=sciChartSurface, Mode=TwoWay}">
        <s:SciChartOverview.Resources>
            <Style TargetType="{x:Type s:SciChartOverview}">
                <Setter Property="Template">
                    <Setter.Value>
                        <ControlTemplate TargetType="{x:Type s:SciChartOverview}">
                            <Grid x:Name="PART_Container">
                                <s:SciChartSurface
                                    x:Name="PART_BackgroundSurface"
                                    Padding="{TemplateBinding Padding}"
                                    Background="{TemplateBinding Background}"
                                    BorderThickness="0"
                                    DebugWhyDoesntSciChartRender="False"
                                    FontSize="{TemplateBinding FontSize}"
                                    FontWeight="{TemplateBinding FontWeight}"
                                    Foreground="{TemplateBinding Foreground}"
                                    RenderPriority="Normal"
                                    UseLayoutRounding="True">
                                    <s:SciChartSurface.ViewportManager>
                                        <s:DefaultViewportManager>
                                            <s:DefaultViewportManager.Services>
                                                <Utility:ServiceContainer />
                                            </s:DefaultViewportManager.Services>
                                        </s:DefaultViewportManager>
                                    </s:SciChartSurface.ViewportManager>
                                    <s:SciChartSurface.YAxis>
                                        <s:NumericAxis
                                            AutoRange="Once"
                                            DrawMajorBands="False"
                                            DrawMajorGridLines="False"
                                            DrawMinorGridLines="False"
                                            IsPrimaryAxis="True"
                                            UseLayoutRounding="True"
                                            Visibility="Collapsed">
                                            <s:NumericAxis.Services>
                                                <Utility:ServiceContainer />
                                            </s:NumericAxis.Services>
                                            <s:NumericAxis.TickProvider>
                                                <s:NumericTickProvider />
                                            </s:NumericAxis.TickProvider>
                                            <s:NumericAxis.TickCoordinatesProvider>
                                                <s:DefaultTickCoordinatesProvider />
                                            </s:NumericAxis.TickCoordinatesProvider>
                                        </s:NumericAxis>
                                    </s:SciChartSurface.YAxis>
                                </s:SciChartSurface>
                                <s:SciChartScrollbar
                                    x:Name="PART_Scrollbar"
                                    Height="{Binding ActualHeight, ElementName=PART_BackgroundSurface}"
                                    Axis="{TemplateBinding Axis}"
                                    Style="{TemplateBinding ScrollbarStyle}" />
                            </Grid>
                        </ControlTemplate>
                    </Setter.Value>
                </Setter>
            </Style>
        </s:SciChartOverview.Resources>
    </s:SciChartOverview>
The problem was with “SciChartSurface.YAxes”. I am not sure, what kind of work doing this element, but without it all working fine.

- Konstantin Shapovalov answered 4 years ago
- You must login to post comments
Please login first to submit.
