Hello all,
I am implementing polar chart in my wpf application, and I am trying to customize the next with no success:
– Xaxis data range is between the lowest and the highest value. I need that xaxis goes from 0º to 360º, but sometimes my angle dataseries does not cover the whole range (i.e. it goes from 15º to 270º). I’ve tried a customtickprovider, setting VisibleRange from 0 to 360º, but it doesn’t work. Any ideas?
– I need that the line connecting to points is a straight, but a curve is drawn instead. Is there any property in PolarXAxis or FastLineRenderableSeries to achieve this?
Regards,
Juan
- You must login to post comments
Hi Juan,
Thanks for your question. You should set AutoRange to “Never” on the XAxis and VisibleRange to “0, 360”. Please refer to this AutoRange article for more info.
Concerning the other issue, could you please clarify what exactly you’d like to see? Any screenshots would be very helpful.
Best regards,
Yuriy
- Yuriy Zadereckiy answered 8 years ago
- You must login to post comments
Hi Yuriy,
I tried Autorange “Never” and VisibleRange (0,360) (both in xaml and code behind, but no simultaneously) but it doesn’t work. Am I doing something wrong? Here is an example code:
            <s:SciChartSurface.XAxis>
            <s:PolarXAxis Name="xAxis" AxisTitle="Polar Chart" BorderBrush="#93A3C5" BorderThickness="0,2,0,0" TitleFontSize="20" VisibleRange="0,360" AutoRange="Never"/>
        </s:SciChartSurface.XAxis>
Code behind:
            var dataSeries = new XyDataSeries<double, double>();

        lineRenderSeries.DataSeries = dataSeries;

        double[] x = new double[5];
        double[] y = new double[5];
        x[0] = 25;
        x[1] = 40.2;
        x[2] = 63.78;
        x[3] = 91;
        x[4] = 103.60;
        y[0] = 0.5;
        y[1] = 0.2;
        y[2] = 0.178;
        y[3] = 0.4;
        y[4] = 0.94;

        // Append data to series. SciChart automatically redraws
        dataSeries.Append(x, y);

        sciChartSurface.AnimateZoomExtents(TimeSpan.FromMilliseconds(1500));

        this.sciChartSurface.XAxis.AutoRange = AutoRange.Never;
        this.sciChartSurface.XAxis.VisibleRange = new DoubleRange(0, 360);
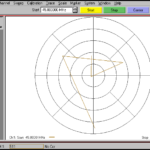
You can see what is shown in first attached picture.
Regarding other issues, the line connecting two points is a bend, but I want a straight (see attached pictures)
- Jose Mora Almerich answered 8 years ago
- You must login to post comments
Hi again Yuriy,
I have solved the issue related to VisibleRange. The problem was in AnimateZoomExtents. If I comment this code line, the visible range is ok.
However, I didn’t find a solution for line connecting points (see attached pictures in previous post)
Regards,
Juan
- Jose Mora Almerich answered 8 years ago
- You must login to post comments
Please login first to submit.


