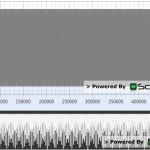
When the chart has hundreds of thousands of data points the bottom half of the overview chart renders improperly. Strange thing is the top half renders as expected (usually). The problem gets worse with the more points there are. And the inaccurate rendering on the bottom half changes as the width of the overview is changed when resizing the window.
The example image I’ve attached illustrates the problem. The data series is a pure sine wave with 500,000 points. In my actual app sometimes the rendering is MUCH worse than the example shows, both on the top and bottom.
Any idea what’s going on or how I can fix it, work around it? This is a showstopper issue for my application.
        chart.YAxis.GrowBy = new DoubleRange(0.1, 0.1);
        chart.XAxis.AutoRange = Abt.Controls.SciChart.Visuals.Axes.AutoRange.Always;
        chart.YAxis.AutoRange = Abt.Controls.SciChart.Visuals.Axes.AutoRange.Always;

        var series = new XyDataSeries<double, double>();

        for (int i = 0; i < 500000; i++)
        {
            series.Append(i, Math.Sin(2 * Math.PI * i / 1000));
        }

        lineSeries.DataSeries = series;

        overview.ParentSurface = chart;
        overview.DataSeries = series;
        overview.AreaBrush = null;
- David Adams asked 9 years ago
- last edited 9 years ago
- You must login to post comments
Interesting bug (feature?) you found there. The overview has a MountainChart in it, which is configured to resample the main DataSeries, saves memory for most series, but for your sine wave looks awful.
A workaround by tweaking properties of the SciChartOverview (e.g. series type, resampling mode) is not very easy, but, you can create your own ControlTemplate for the overview to override what type of series it has in it:
    <!-- Default Control Template for SciChartOverview (v3.2) -->
    <ControlTemplate TargetType="visuals:SciChartOverview">
        <Grid Name="PART_Container">
            <visuals:SciChartSurface x:Name="PART_BackgroundSurface"
                                Background="{TemplateBinding Background}"
                                BorderThickness="0"
                                FontSize="{TemplateBinding FontSize}"
                                FontWeight="{TemplateBinding FontWeight}"
                                Foreground="{TemplateBinding Foreground}"
                                Padding="{TemplateBinding Padding}">

                <visuals:SciChartSurface.RenderableSeries>
                    <!-- Here is where you can change the overview series type -->
                    <r:FastMountainRenderableSeries AreaBrush="{TemplateBinding AreaBrush}"
                                            DataSeries="{TemplateBinding DataSeries}"
                                            SeriesColor="{TemplateBinding SeriesColor}" />
                </visuals:SciChartSurface.RenderableSeries>

                <visuals:SciChartSurface.YAxis>
                    <axes:NumericAxis AutoRange="Always"
                                DrawMajorGridLines="False"
                                DrawMinorGridLines="False"
                                TextFormatting="###E+0"
                                Visibility="Collapsed">
                        <axes:NumericAxis.GrowBy>
                            <scichart:DoubleRange Max="0.1" Min="0.0" />
                        </axes:NumericAxis.GrowBy>
                    </axes:NumericAxis>
                </visuals:SciChartSurface.YAxis>

            </visuals:SciChartSurface>

            <visuals:SciChartScrollbar x:Name="PART_Scrollbar"
                                Axis="{TemplateBinding Axis}"
                                Style="{TemplateBinding ScrollbarStyle}" />
        </Grid>
    </ControlTemplate>
Alternatively, you can dump overview altogether and use this technique to display any UI (including another SciChartSurface) behind a SciChartScrollBar
Creating a Custom SciChartOverview with many series using the ScrollBar API
Best regards,
Andrew
- Andrew Burnett-Thompson answered 9 years ago
 The ControlTemplate fix works! All I had to do was change FastMountainRenderableSeries to FastLine and it looks great now. Thank you!
- You must login to post comments
Please login first to submit.

