Hello SciChart-Team,
I noticed that the columns in Sparse Column3D and in Uniform Column 3D always start at the XZ surface. Is there any option or way to do so, that columns always use the zero value of the Y axis as their starting point. The visible range of the axes should correspond to the minimum and maximum Y values.
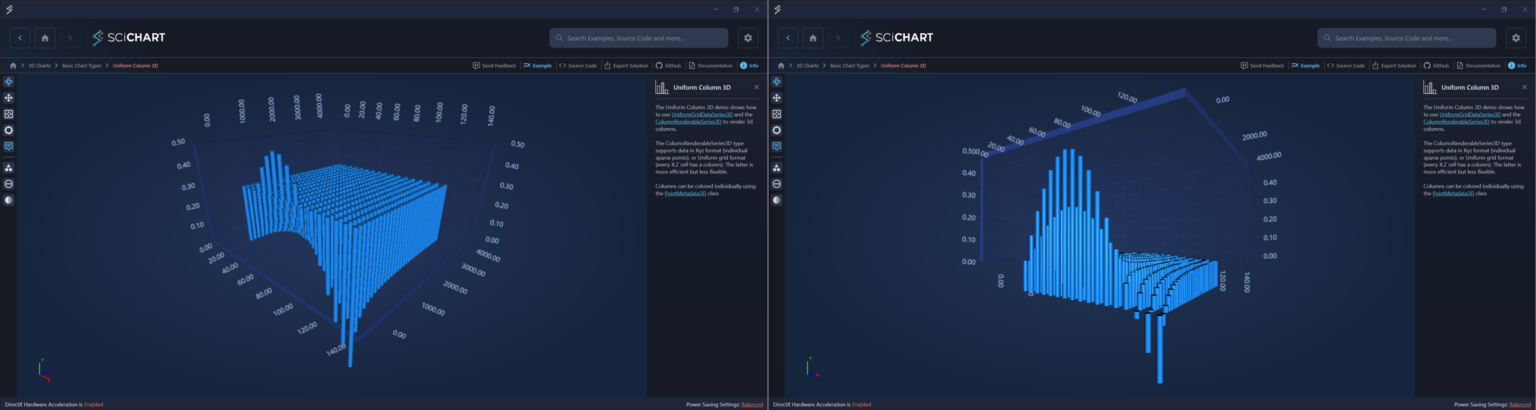
The current behavior can be reproduced in the example SciChart_UniformColumn3D:
If the VisibleRange of the Y-axis goes from 0 to 0.5 then the columns with negative values go down (see screenshot 1)
As soon as the VisibleRange of the Y-axis goes from -0.5 to 0.5, the columns look like this (Screenshot2) We need the columns to look like in Screenshot 1, only that the Y-axis is also visible downwards.
Can the starting point of the columns be changed?
Best regards
Silvester


- Silvester Schneidt asked 3 years ago
- last edited 3 years ago
- You must login to post comments
Hello Lex,
I tried the new property with version 7.01.
And it works perfectly, just the way we need it.
Thank you for the implementation.
Best regards
Silvester
- Silvester Schneidt answered 1 year ago
- You must login to post comments
Hi Silvester,
I’m glad to inform you that we’ve introduced ZeroLineY property for the Column 3D chart type in the latest SciChart v7.0.1.
You can find more info in the corresponding section of the following documentation article:
ZeroLineY for 3D Columns
This feature allows specifying Zero position for 3D Column series
relatively to YAxis. By default, all 3D Columns begin at XZ plane
position. Now it is possible to set Y-Value at which 3D Columns will
start:
This can be achieved setting ZeroLineY property on
ColumnRenderableSeries3D instance:<s3D:SciChart3DSurface.RenderableSeries> <s3D:ColumnRenderableSeries3D ZeroLineY="-0.15" DataPointWidthX="0.8" Opacity="1"/> </s3D:SciChart3DSurface.RenderableSeries>
Please upgrade your project and let us know your feedback.
With best regards,
Lex
- Lex answered 1 year ago
- last edited 1 year ago
- You must login to post comments
Please login first to submit.
