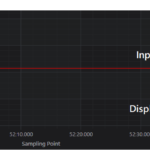
My application is an oscilloscope application. It is a two-dimensional graph, the X axis is TimeSpanAxis, and the Y axis is NumericAxis.
When I add data to the DataSeries of the curve, if the value is too large, such as: double.MaxValue, double.Minvalue, etc., the curve will be presented as an approximate value, as shown in the figure(Input: 9007199254740992; Display: 9007199254740990).
What should I do to accurately display the maximum or minimum values, such as: double.MaxValue (1.7976931348623157E + 308), ulong.MaxValue (18446744073709551615), … etc.
- Johnny Yeh asked 4 years ago
- You must login to post comments
Please login first to submit.

