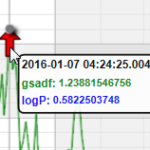
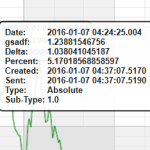
Upon your advice for a recent question, I have converted my annotations over to an XY scatter point series, using custom point markers to render them. That is working beautifully and is much faster than creating annotations as WPF UIElements. I now need to figure out if/how I can get the tooltips displaying like I would prefer.
I currently have a cursor modifier that I’m using to display a consolidated rollover tooltip for all of the visible series. However, now that the annotations are data series also, their information is getting included in this tooltip and I don’t want it to. I would like to have a separate tooltip that appears when the mouse is hovering over a custom point marker that displays the custom metadata for the point. This was the functionality I had working when I was creating the annotations as actual annotations. I’m hoping I can achieve it when creating them as regular data points.
So I guess my questions are: Is there a way to only include certain data series for a given chart modifier so I can keep my “regular” data and “annotation” data segregated? And, is there a way to show a tooltip with metadata only when the actual point is hovered? I was looking at the Series With Metadata example which is similar to what I want to achieve, but the tooltip appears whenever the mouse hovers over anything, not just when it’s over an actual point.
Thanks,
Scott
- sdamge asked 8 years ago
- You must login to post comments
Hi Scott, in answer to your second question, how to improve the hit-test of markers, you can try this code:
public class TooltipModifierEx : TooltipModifier
{
   // Experiment with this value
    const double OVERRIDE_RADIUS = 20.0d;

    /// <summary>
    /// Enumerates RenderableSeries on the parent <see cref="ChartModifierBase.ParentSurface"/> and gets <see cref="SeriesInfo"/> objects in given point
    /// </summary>
    /// <param name="point"></param>
    /// <param name="hitTestRadius"></param>
    /// <returns></returns>
    protected virtual IEnumerable<SeriesInfo> GetSeriesInfoAt(Point point, double hitTestRadius)
    {
        return GetSeriesInfoAt(renderSeries => renderSeries.HitTest(point, OVERRIDE_RADIUS, UseInterpolation));
    }
}
This overrides the default hit-radius and allows 20 pixels for hit-testing. Please note that this will centre the hit-circle on the X Y datapoint so hovering directly above the marker will also cause a tooltip to show. However, it should decrease the sensitivity of the TooltipModifier and make the tooltips slightly more usable.
Best regards,
Andrew
- Andrew Burnett-Thompson answered 8 years ago
- You must login to post comments
It looks like my images were not attached to my comment. Here they are.
- sdamge answered 8 years ago
- You must login to post comments
To exclude a series from the CursorModifier, you can use
<s:XyScatterRenderableSeries s:CursorModifier.IncludeSeries="False"/>
To then include a series for the TooltipModifier instead, you can use
<s:XyScatterRenderableSeries s:CursorModifier.IncludeSeries="False"
      s:TooltipModifier.IncludeSeries="True"/>
Make sure you have included both CursorModifier and TooltipModifier in your SciChartSurface.ChartModifier group.
Finally, you can template the tooltip on a per-series basis by using the TooltipModifier.TooltipTemplate attached property. Full steps can be found in our TooltipModifier Documentation.
- Andrew Burnett-Thompson answered 8 years ago
 Fantastic! I made the changes and it works perfectly now. Thanks! The documentation is great, but it’s also vast, so it’s sometimes hard to find what you need, especially when you’re not sure what you’re looking for :) One minor thing (and I realize this may not be possible): I am using custom point markers that inherit from BasePointMarker and use custom drawing code. I am using arrows for my markers and they are drawn such that the tip of the arrow is pointing at the actual data point. However, this won’t necessarily be apparent to the user. If I hover over the arrow, the tooltip is not shown (see attached image 1). If I hover over the actual point (attached image 2) then the tooltip is shown. Is there any way to set things so that the tooltip is shown when the mouse is over any part of the custom marker? Again, I realize this is probably not possible, but thought I would ask anyway.
 Hi Scott, this is due to the Tooltip Hit-Radius on the TooltipModifier, which is default 7 pixels. I’ve asked the team if there is a way to override it.
- You must login to post comments
Please login first to submit.


