Hello,
I’m having some trouble because all the points in a DataSeries have the same value, and those values are rendered outside the surface. (By constant values I mean that all the values on the y axis are equal to 19.8).
If I put a zoom modifier on the chart and zoom out, I can find my values, but when the chart is displayed for the first time, they are not visible.
This makes me think that the scaling of the y axis is not calculated correctly on the chart.
I have attached a code example.
- Straliciuc asked 12 years ago
- You must login to post comments
Hi Straliciuc,
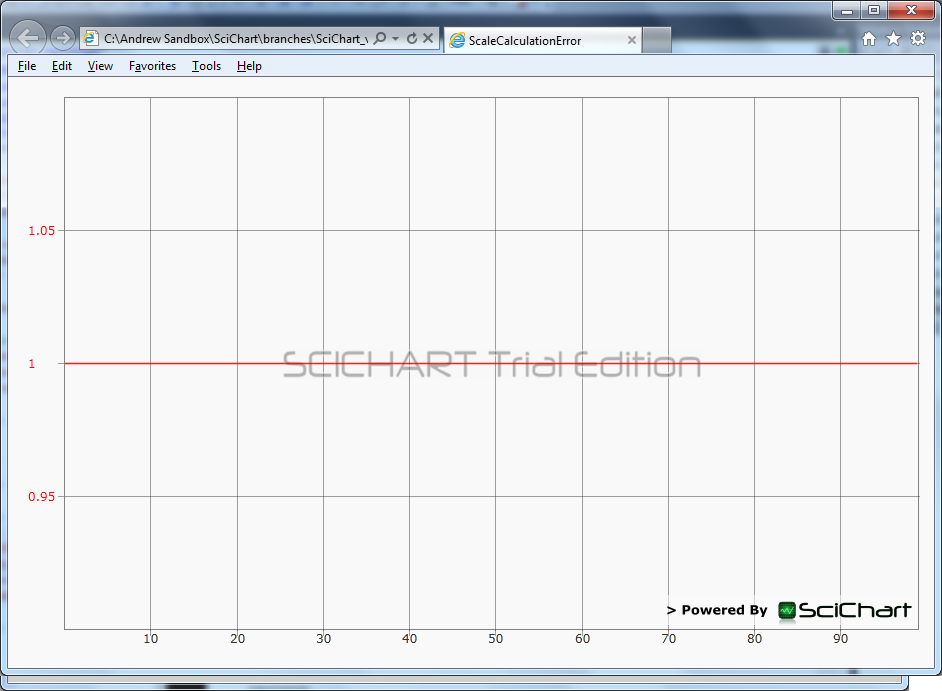
This can be resolved by setting a YAxis.GrowBy value as follows:
<s:SciChartSurface x:Name="sciChartSurface" s:ThemeManager.Theme="BrightSpark" >
    <s:SciChartSurface.ChartModifier>
        <s:ModifierGroup>
            <s:LegendModifier x:Name="legendModifier"/>
            <s:MouseWheelZoomModifier />
            <s:ZoomPanModifier  />
        </s:ModifierGroup>
    </s:SciChartSurface.ChartModifier>

    <!-- Defines the renderable series, which map 1:1 to data-series. R-Series may be styled -->
    <s:SciChartSurface.RenderableSeries>
        <s:FastLineRenderableSeries SeriesColor="Red" YAxisId="yAxis1"/>
    </s:SciChartSurface.RenderableSeries>

    <!-- Defines the XAxis -->
    <s:SciChartSurface.XAxis>
        <s:NumericAxis>
        </s:NumericAxis>
    </s:SciChartSurface.XAxis>

    <!-- Defines the YAxis -->
    <s:SciChartSurface.YAxes>
        <s:NumericAxis TickTextBrush="red"  AxisAlignment="Left" Id="yAxis1" >
          <s:NumericAxis.GrowBy>
            <s:DoubleRange Min="0.1" Max="0.1"/>
          </s:NumericAxis.GrowBy>
        </s:NumericAxis>
    </s:SciChartSurface.YAxes>
</s:SciChartSurface>
Note that the calculation to generate the YAxis range is as follows:
- Get data Min, Max of the axis
- If Min == Max, expand the range using GrowBy. Max = max+GrowBy.Max and Min = Min – GrowBy.Min
UPDATE: This issue was fixed in v2.0 or later of SciChart. It will now automatically expand the range around constant values even without a GrowBy.
Hope this helps!
- Andrew Burnett-Thompson answered 12 years ago
 Yep, it worked! Thanks!
- You must login to post comments
Please login first to submit.