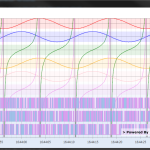
I made an example based on the “Vertically Stacked Axes” from SciChart Examples. The main difference is that I can add DataSeries / YAxes on the fly.
The problem is that when I set VisibleRange and VisibleRangeLimit it does not crop the trace (as you can see on the Tan traces that are drawn on the whole surface).
Is there any way to crop the traces to VisibleRange of corresponding Axis?
- Jan Kaiser asked 9 years ago
- You must login to post comments
Hi Jan,
I’m not sure what’s going on here, but can I point you to our article on VisibleRangeLimit which proposes another way to clip or force VisibleRange into a certain range.
Advanced VisibleRange Clipping and Manipulation
So the VisibleRangeLimit is a useful API to ensure the axis clips the
VisibleRange when zooming to extents. But it won’t stop a user from
scrolling outside of that range.What if you wanted to ensure that a certain range was never exceeded?
Simple, just subscribe to AxisBase.VisibleRangeChanged and set the
range to whatever you wantaxis.VisibleRangeChanged += (s, e) => { // e is VisibleRangeChangedEventArgs // Assuming axis is NumericAxis if (e.NewVisibleRange != null && e.NewVisibleRange.Min < 0) { // Force minimum visiblerange to zero always ((NumericAxis)sender).VisibleRange = new DoubleRange(0, e.NewVisibleRange.Max); } };Great! How to do that in MVVM?
Glad you asked! Well, you could use EventToCommand to push the
VisibleRangeChanged event into a ViewModel. Or, our preferred method
would be to create an Attached Behavior. Simply create a class with
attached property and in the property changed handler, set your code
to clip axis visible range. For more info on Attached Behaviors,
please see this Codeproject article.
Best regards,
Andrew
- Andrew Burnett-Thompson answered 9 years ago
- You must login to post comments
There is maybe misunderstanding in what VisibleRangeMeans.
It clearly defines Min and Max value that corresponds to Min/Max position on the axis.
It does not modify the data in the series in no way.
In case of Vertically Stacked Axes, the series are drawn outside of the bounds of its y axis (see Fig.1). For some it is nice feature.
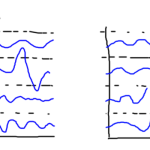
But I would like to clip “visually” the series to the bounds defined by min/max of its y-axis. Thus line of one series will not go to the area of another series (see Fig.2).
Is it possible?
Thanks
Jan
- Jan Kaiser answered 9 years ago
 Hi Jan, if you want to clip the ranges, there is no need to use the Vertically Stacked Axis feature. Instead, just have multiple SciChartSurfaces each with their own YAxis. The purpose of the Vertically Stacked Axis example & feature is to allow the case where you have many charts above/below each other, but you wish the series to be able to draw in each other's chart areas. Hope this helps!
- You must login to post comments
Please login first to submit.


