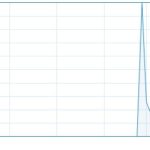
I have introduced a real time chart in my WPF Application. The chart starts plotting points from the left of the chart ( close to Y-Axis).
I would like it to start plotting from the right of the chart ( Away from Y-Axis) and as when points start adding up, I would like the points to slide to the left ( Towards Y-Axis).
Similar to how performance tab in Task Manager displays the CPU utilization.
- Parvez Mulla asked 7 years ago
- You must login to post comments
Hi Paul,
There’s a sample here on how to do this: How to Create a Scrolling Strip Chart in SciChart?
This should be exactly what you’re looking for.
Does it help?
Best regards,
Andrew
- Andrew Burnett-Thompson answered 7 years ago
- You must login to post comments
Please login first to submit.

