Hello i am new in using SciChart before that i was using OpenTK, i would like to create XY, XZ, YZ plane/slice in 3D chart like in OpenTK (example of using OpenTK in picture). User will be able to move slices in every direction depending on selected dimension. Is it possible to do this in SciChart?

- Ivan Zvara asked 2 years ago
- You must login to post comments
Hi Ivan
We have something similar but not exactly like this in SciChart WPF 3D
This example shows how you can use a Surface Mesh chart and flatten it, to place at the floor or ceiling of an axis cube. So it’s certainly possible to have a surface mesh flattened to look like a heatmap.

However I don’t believe it is possible to rotate the mesh into XY, ZY planes.
The closest workaround is to use scatter or point-cloud series instead of surface mesh and place them as follows. .
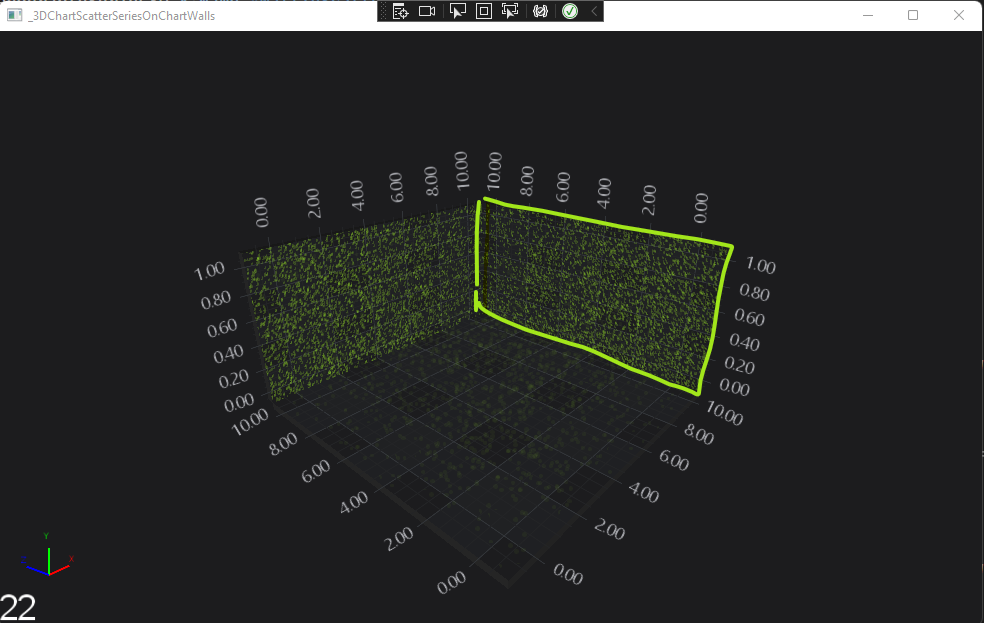
Here we use point clouds and position them onto the walls of the axis cube. Point clouds support scatter points at XYZ values with custom size and colour per point, so you could create a sparse heatmap similar to the above with three series.
Take a look, its the closest we have at this time
Best regards
Andrew
- Andrew Burnett-Thompson answered 2 years ago
- You must login to post comments
Please login first to submit.
