I understand how to bind properties when using WPF WVVM but in my case I am using SciChart hosted in an ElementHost so I’m doing everything in Windows Forms code behind.
I have draggable vertical line annotations working but I need to get the coordinates as the user drags them. Is that possible?
- David Adams asked 9 years ago
- last active 5 years ago
hi:
As shown below, I want to fill different colors between the two lines according to my own rules,
I first adopted scheme 1: use FastBandRenderableSeries, but it has default rules, according to the size of Y1 and Y2, fill between Y1 and Y2 Predefined FillY1 and FillY2;
I can't change this behavior by implementing IFillPaletteProvider.
So I switched to Scenario 2: Use two FastLineRenderableSeries to form the band, but I don't know how to fill the color between the two FastLineRenderableSeries.
Does scichart support filling color between two lines according to custom rules?   my scichart version is 6.3.0.13476
Please give me some help or advice.
thanks very much.
- Pengwei Gao asked 2 years ago
- last active 2 years ago
I’ve created a custom CHartmodifier like:
http://support.scichart.com/index.php?/Knowledgebase/Article/View/17255/32/custom-chartmodifiers—part-6—select-data-points-via-mouse-drag
My chart has different Markers: Point,Square and TrianglePointMarkers
How can I highlight this different markers (Fill gray if selected)?
- Daniel Hartl asked 9 years ago
- last active 9 years ago
I am building a real time chart to display ECG data. I would like to, on the fly, be able to change the amount of time displayed on the x axis. In other words, the user can select the number of seconds of ECG data being displayed. The display sweeps across the time range then throws out old data after the sweep reaches the end of the time range then restarts at the beginning of the chart.
To do this, I am using a Fifo series and I am setting up the FifoCapacity to be just large enough to hold the desired number of seconds of data (sample rate x desired number of seconds). I also set the XVisibleRange to be equal to the desired time range. This works fine – the waveform sweeps to the end then restarts the trace. Now, when the user wants to change the time range (say from 6 seconds to 10 seconds of data for example) I think I need to do the following:
- create a new xyDataSeries with the FifoCapacity set at the new value of sample rate x desired number of seconds
- copy the data from the old series into the new series so it’s not lost from the chart
- bind the new series into the FastLineRenderableSeries DataSeries
- update the XVisibleRange to the new time range
Is this correct? If yes, how do I copy the data from the old series into the new series. I looked over the api documentation but it’s not clear to me. I see a clone() method but this is not what I want since I want a different FifoCapacity. Instead of creating a new series and copying old data into it, can I simply change the FifoCapacity property on the existing series?
Thanks for your help.
- Gary Arnold asked 9 years ago
- last active 9 years ago
Hi,
I’m learning SciChart, and tried following this tutorial https://www.scichart.com/example/wpf-chart/wpf-3d-chart-example-add-objects-to-3d-chart/. I tried adding a mesh I generated in blender, as well as using the knight piece from the same source as the example. It looks to me like the normal vectors on the objects are inverted. This is definitely not a problem with my model, as multiple other .obj viewers don’t have a problem displaying my mesh, and the knight piece isn’t mine anyway. I exported the example into Visual Studio and it worked fine, all the pieces were solid. Does anyone have any idea what I’ve goofed here?
- Will Wright asked 2 years ago
- last active 1 year ago
So, i am currently evaluating Scichart for a realtime monitoring application. One of the key requirements will be a gantt-style chart with one axis being time, the other being specific work channels. A single series might have entries across multiple channels. Additionally, I’d want to be be able to show subgroups from a particular series point and stack the bars next to each other in the same channel. Is this possible in SciChart? If so, what would be the best way to implement this?
- Robert Potter asked 9 years ago
- last active 9 years ago
I have a huge dataset to display in graphical form starting from the daily data for 30 days and then to each minute when zoom in, what is the best way to plot this data using zoom in functionality
- Umer Nawaz asked 1 year ago
- last active 1 year ago
Hi,
I’ve been trying to make the textannotations resize with the graph itself, because the text becomes very large compared to the graph if the window is sized to be smaller.
I’ve seen some people have asked the same question before me, but the solution with the Scale Transforms is offsetting the annotations when the graph is resized, which doesn’t look good, and the ControlTemplate Solution here: https://www.scichart.com/questions/question/text-annotation-size isn’t working and puts up a background color which I can’t seem to get rid of.
I also looked at making a controltemplate for BoxAnnotations but I’m using Properties that aren’t defined in BoxAnnotation such as the HorizontalAnchorPoint.
This is the template I’m trying to use:
            <Style TargetType="{x:Type SciChart:TextAnnotation}">
            <Setter Property="Template">
                <Setter.Value>
                        <ControlTemplate TargetType="SciChart:TextAnnotation">
                            <Border x:Name="PART_TextAnnotationRoot"
        Margin="{TemplateBinding Margin}"
        Background="{TemplateBinding Background}"
        BorderBrush="{TemplateBinding BorderBrush}"
        BorderThickness="{TemplateBinding BorderThickness}"
        CornerRadius="{TemplateBinding CornerRadius}">
                                <Viewbox Stretch="{TemplateBinding TextStretch}">
                                    <TextBox x:Name="PART_InputTextArea"
             Margin="{TemplateBinding Padding}"
             VerticalAlignment="{TemplateBinding VerticalAlignment}"
             AcceptsReturn="True"
             Background="Transparent"
             BorderThickness="0"
             FontFamily="{TemplateBinding FontFamily}"
             FontSize="{TemplateBinding FontSize}"
             FontWeight="{TemplateBinding FontWeight}"
             Foreground="{TemplateBinding Foreground}"
             IsEnabled="{Binding CanEditText,
                                 RelativeSource={RelativeSource TemplatedParent}}"
             IsTabStop="{TemplateBinding IsEditable}"
             Text="{Binding Text,
                            RelativeSource={RelativeSource TemplatedParent},
                            Mode=TwoWay}"
             TextAlignment="{TemplateBinding TextAlignment}"
             TextWrapping="Wrap" />
                                </Viewbox>
                            </Border>
                        </ControlTemplate>
                    </Setter.Value>
            </Setter>
        </Style>
Any help would be appreciated.
- Keke Porlat asked 9 years ago
- last active 9 years ago
The project is developed on SciChart JS.
The x axis is date time numeric and y axis is numeric.
There is a option for the user to select the x axis interval. The interval values are 5 Min, 10 Min, 15 Min, 30 Min, 1 Hour, 6 Hour, 12 Hour, Days, Weeks, Months & Years.
When the user the selects a interval in the select option, the x axis should be updated with the selected interval.
For Example, If the user selects the 5 Min in the select option, then the x axis interval should be 5 Min.
For 5 Min X Axis Interval
16-Jan-2023 07:00
16-Jan-2023 07:05
16-Jan-2023 07:10
16-Jan-2023 07:15
16-Jan-2023 07:20
16-Jan-2023 07:25
16-Jan-2023 07:30
For 1 Hour X Axis Interval
16-Jan-2023 07:00
16-Jan-2023 08:00
16-Jan-2023 09:00
16-Jan-2023 10:00
16-Jan-2023 11:00
16-Jan-2023 12:00
16-Jan-2023 13:00
16-Jan-2023 14:00
So let me know how to change the interval in the x axis (date time numeric) based on the selection.
I have attached the zip file which contains the HTML file.
- Leo Leslin asked 1 year ago
- last active 5 months ago
Have you guys ever seen the attached stack trace? It appears to happen when our view model gets activated and the annotations get unbound and rebound quickly during view model activation. It’s difficult to reproduce and is very specific to certain view models so I’m not going to try to create a sample application that has the issue, but perhaps you’ve seen the stack trace before or know something about it.
Thanks for any help!
Matthew
- Matthew Trahan asked 1 year ago
- last active 9 months ago
Hello.
Is there a way to hide points out of the Visual Range in SciChart3DSurface?
- nada nada asked 1 year ago
- last active 1 year ago
I would like a custom cursor.
I want the Y axis label like the one with the cursor.
The X axis label with steps like the one with the rollover (not seeing intermediate values as the cursor do for the X axis label).
If I do a drag and drop, I want a ruler to measure a distance in X unit (DateTime), and Y unit (double price).
I assume it would be done with 2 chartmodifier, one with the cursor, the other for the ruler.
The first one is always active, and the second one only while the left mouse button is down.
Do you have a code sample to help me ?
- Nicolas Vitale asked 8 years ago
- last active 8 years ago
I have a real time updated chart with very large data size and I am facing the slow client problem. i.e. The data sending speed is faster than the data receiving and handling speed which causes memory growing up issue. I am trying to use Web Workers to increase the data handling speed in frontend. I have found a related post:
https://www.scichart.com/questions/wpf/is-xydataseries-safe-to-being-changed-in-a-separate-thread
It seems possible to update XyDataSeries in the background thread with WPF. My UI is built with NextJS. I tried to use Web Workers to implement multiple threads. But I found that it can’t pass the SciChartSurface or XyDataSeries to the worker thread. Could you show me an example on how to update XyDataSeries in the worker thread with Web Workers?
- Quyen Sy asked 1 year ago
- last active 1 year ago
Hello,
I’m Using the FastMountainRenderableSeries to fill the area under/over the Data points with a color gradient.
However, the gradient always seems to adapt to the currently shown data values and uses the maximal and minimal value of the displayed data as the “poles” for the coloring.
In the attached image, Data is displayed with a maximal value of 2 and a minimal value of -2. The gradient (from white to black) uses these values to map the color. -2 corresponds to white and 2 corresponds to black, and the room between is interpolated.
If I were to change the displayed data to have a different max/min value, the gradient would adapt accordingly.
Here is the relevant code I’m using:
FastMountainRenderableSeries m_graph = new FastMountainRenderableSeries();
m_graph.ZeroLineY = 0;
m_graph.AntiAliasing = true;
m_graph.Fill = new LinearGradientBrush(Colors.Black, Colors.White, 90);…adding datapoints…
My question is, is there is a way to gain more control over the way the colors of the gradient are mapped onto the area under/over the data points?
For example, maybe I want the black->white gradient only to go from 2->1 and everything above 2 is black and everything below 1 is white, no matter what range the displayed values currently have.
Ideally it would be possible to create/overwrite a “color-mapping”-function that accepts double values and returns colors to fill the are under/over the data points.
Thank you.
- Marc Vahldieck asked 10 months ago
- last active 10 months ago
I want to create two xAxis, the first one will be a normal xAxis and the second one will be an array of date ranges, but the issue then is that since all the xAxis are inside one array together, they all are stacked on top of each other.
I tried sciChartSurface.layoutManager.bottomOuterAxesLayoutStrategy = new BottomAlignedOuterHorizontallyStackedAxisLayoutStrategy(); but that only create all xAxis into one line of xAxis.
I want two line of xAxis, where the first one is normal, but second xAxis should be Horizontally Stacked Axis Layout.
The first image is before horizontal stacked is applied and the second after.
The third image show the xAxes array from sciChartSurface.xAxes, the index(0) of the array is the first xAxis, which should be normal, and the rest (index 1 – 8) should be horizontally stacked.
The horizontal stacked xAxis should be right below the first xAxis.
- Nung Khual asked 9 months ago
- last active 9 months ago
Hi,
I ran into a problem with EllipsePointMarkers when I have a big amount of PointMarkers inside the Rendersurface. Here is a brief description of what I am trying to do:
-
I created a custom BasePointMarker-derived class which draws Ellipses with a varying Color – depending on some threshold defined in the IPointMetaData implementation
-
Everything works fine as long as the points are not tightly spaced between each other. That said, when I rescale my Rendersurface, the points get shifted so that the red points (who are below the threshold) will move up and suddenly green points are at minimum YValue positions.
I attached two pictures which hopefully illustrate my problem better than my words can do. Maybe somebody knows a workaround / fix for this problem. Any help is appreciated! ( I assume it has sth to do with the RescaleMode which prevents some points from being drawn to the surface and shifts others so that the Chart isn’t too dense)
Best,
Matthias
Update
Since Andrew suggested that the behavior comes from my custom code (which is hopefully true), here are the relevant parts:
DiaryView.xaml
<s:SciChartSurface Grid.Row="1" Grid.Column="0"
                       s:ThemeManager.Theme="Chrome"
                       Background="White" RenderableSeries="{s:SeriesBinding DiarySeriesViewModels}">
        <s:SciChartSurface.RenderSurface>
            <s:HighQualityRenderSurface/>
        </s:SciChartSurface.RenderSurface>
        <s:SciChartSurface.YAxis>
            <s:NumericAxis AxisAlignment="Left" DrawMajorBands="False" VisibleRange="0,900"/>
        </s:SciChartSurface.YAxis>
        <s:SciChartSurface.XAxis>
            <s:DateTimeAxis DrawMajorBands="True" VisibleRangeLimit="{Binding VisibleRangeLimit}"
                            DrawMinorGridLines="False"
                            x:Name="XAxis"
                            CursorTextFormatting="dd.MM.yyyy HH:mm"/>
        </s:SciChartSurface.XAxis>
    </s:SciChartSurface>
DiaryViewModel.cs
Property:
public List<IRenderableSeriesViewModel> DiarySeriesViewModels { get; private set; }
inside the Constructor:
this.DiarySeriesViewModels.Add(new LineRenderableSeriesViewModel()
        {
            AntiAliasing = true,
            PointMarker = new DiaryPointMarker()
            {
                AntiAliasing = true,
                LowRatingColor = Brushes.Red,
                MidRatingColor = Brushes.Orange,
                HighRatingColor = Brushes.Green,
                Width = 10,
                Height = 10,
                StrokeThickness = 2
            },
            DataSeries = GetSampleSeries()
        });
GetSampleSeries():
private XyDataSeries<DateTime, double> GetSampleSeries()
    {
        var series = new XyDataSeries<DateTime, double>();

        var startDate = this.VisibleRangeLimit.Min.AddDays(5);
        var currentDate = startDate;
        int i = 0;
        while (currentDate < DateTime.Now)
        {
            var yval = 60*(Math.Log(i))*Math.Abs(Math.Sin(Math.PI*(i++/100.0)));
            currentDate = currentDate.AddHours(5.3);
            string comment = i%20 == 0 ? String.Format("Sample comment #{0}", i) : string.Empty;
            double rating = 100*yval/60;
            series.Append(currentDate,yval,new DiaryPointMetaData(rating,comment));
        }

        return series;
    }
DiaryPointMarker.cs: (based on an example which I found here at SciChart)
public class DiaryPointMarker : BasePointMarker
{
    private IList<IPointMetadata> _dataPointMetadata;
    IList<int> _dataPointIndexes = new List<int>();


    private IPen2D _lowStrokePen;
    private IPen2D _midStrokePen;
    private IPen2D _highStrokePen;


    private IBrush2D _lowRatingColor;
    private IBrush2D _midRatingColor;
    private IBrush2D _highRatingColor;
    private IBrush2D _noCommentColor;

    public Brush LowRatingColor { get; set; }
    public Brush MidRatingColor { get; set; }
    public Brush HighRatingColor { get; set; }

    public override void BeginBatch(IRenderContext2D context, Color? strokeColor, Color? fillColor)
    {
        _dataPointMetadata = _dataPointMetadata ?? RenderableSeries.DataSeries.Metadata;

        _dataPointIndexes = new List<int>();

        base.BeginBatch(context, strokeColor, fillColor);
    }


    public override void MoveTo(IRenderContext2D context, double x, double y, int index)
    {
        if (IsInBounds(x, y))
        {
            _dataPointIndexes.Add(index);
        }

        base.MoveTo(context, x, y, index);
    }

    public override void Draw(IRenderContext2D context, IEnumerable<Point> centers)
    {
        TryCasheResources(context);

        var markerLocations = centers.ToArray();

        for (int i = 0; i < markerLocations.Length; ++i)
        {
            var diaryMetaInfo = _dataPointMetadata[_dataPointIndexes[i]] as DiaryPointMetaData;

            var center = markerLocations[i];

            context.DrawEllipse(
                diaryMetaInfo.Rating < 60 ? _lowStrokePen : diaryMetaInfo.Rating < 80 ? _midStrokePen : _highStrokePen,
                String.IsNullOrEmpty(diaryMetaInfo.Comment) ? _noCommentColor : diaryMetaInfo.Rating < 60 ? _lowRatingColor : diaryMetaInfo.Rating < 80 ?_midRatingColor : _highRatingColor,
                center,
                Width,
                Height
            );
        }
    }

    private void TryCasheResources(IRenderContext2D context)
    {
        _lowStrokePen = _lowStrokePen ?? context.CreatePen(LowRatingColor.ExtractColor(), AntiAliasing, (float)StrokeThickness, Opacity);
        _midStrokePen = _midStrokePen ?? context.CreatePen(MidRatingColor.ExtractColor(), AntiAliasing, (float)StrokeThickness, Opacity);
        _highStrokePen = _highStrokePen ?? context.CreatePen(HighRatingColor.ExtractColor(), AntiAliasing, (float)StrokeThickness, Opacity);

        _lowRatingColor = _lowRatingColor ?? context.CreateBrush(LowRatingColor);
        _midRatingColor = _midRatingColor ?? context.CreateBrush(MidRatingColor);
        _highRatingColor = _highRatingColor ?? context.CreateBrush(HighRatingColor);
        _noCommentColor = _noCommentColor ?? context.CreateBrush(Color.FromArgb(0, 0, 0, 0));
    }
}
- Andreas Haas asked 8 years ago
- last active 7 years ago
Imagine I have a chart with a RolloverModifier, such that I see the point marker, and also a CursorModifier so I see the axis labels with the exact value I’m hovering.
This chart has the axis title hidden, and also the labels hidden, so I can really only see them trough the CursorModifier axis labels.
Since the axis title and labels are hidden, the axis labels spawn inside the chart, and the point marker from the RolloverModifier may be drawn on top of the labels.
I’d like to properly control drawing order here, so my axis labels get prioritised.
Is there a way to do so?
Codepen example: https://codepen.io/jrfv/full/VwqVBdo
- João Velasques asked 7 months ago
- last active 3 months ago
Hello,
I am currently evaluating the chart library, and plotting a FastLineRenderableSeries with an Ellipse PointMarker.
This displays exactly the graph I want. However, I would like that when the user hovers over a point, the point would highlight and he can see a tooltip showing what is the exact X value and the exact Y value.
Example of what I would like : http://www.highcharts.com/demo/line-basic
Would be even better if when hovering over the line the “nearest” actual point were highlighted with the tooltip.
I have tried a quick search and haven’t come up with the solution yet, note I am new to the library.
Thanks
- Jean-Jacques Bouzaglou asked 8 years ago
- last active 8 years ago
Hi –
I could not find an example in the various examples your provide
I have several charts in different components
When a component is closed I want to ensure the chart is destroyed and there is not potential for memory leak
What is this best way of doing this?
Thanks
- Himura Kenshin asked 5 months ago
- last active 5 months ago
Hi, we are using CategoryAxis to display stock data, however, as you can see in the image below, within the “same” candle or volume, divergent information is displayed.
am I doing something wrong?
- rocket trade asked 4 months ago
- last active 4 months ago
I am trying to change the format of CursorModifier
sciChartSurface.chartModifiers.add(
  new CursorModifier({
    modifierGroup: 'Chart',
    showAxisLabels: true,
    showTooltip: false,
    showYLine: false,
    showXLine: true,
  })
);
I have a custom DateLabelProvider for the xAxis that return dates in this format ‘MM/dd HH:mm’ but the CursorModifier tooltip is showing the ‘MM/dd/YYYY’ format, how can I change it?
- Jhonatan Laguna asked 3 months ago
- last active 3 months ago
Please answer about it (https://www.scichart.com/questions/ios/is-it-possible-to-make-customannotation-like-axis-marker-annotation)
- Junyoung Kang asked 2 months ago
I want to put multiple Line Charts on a standard WPF TabControl. One Chart per tab.
Each tab should show a different chart with, in general, a different range on its X axis.
After a chart on a tab has been panned or zoomed, then after switching to another tab and then returning to the original tab, then the original X axis values should be preserved.
My problem is that I end up with a behaviour that looks like all the charts share one X axis.
So my question is how can I achieve the desired behaviour?
I did try databinding XAxis and, later, XAxes, but I ended up with the same behaviour.
Thanks in advance to anyone that can help me out with this.
Here is the briefest example I could construct that displays the problem.
It simply displays 3 tabs with different ranges of X values and AutoRange set to “Once”.
When it runs, all 3 charts are displayed with the same X axis range which is only correctly autoranged for the first tab.
The attached images are screenshots of the three tabs.
Here is my XAML:
<Window
    xmlns="http://schemas.microsoft.com/winfx/2006/xaml/presentation"
    xmlns:x="http://schemas.microsoft.com/winfx/2006/xaml"
    xmlns:local="clr-namespace:SciTest" xmlns:s="http://schemas.abtsoftware.co.uk/scichart" x:Class="SciTest.MainWindow"
    Title="MainWindow" Height="300  " Width="500">
<Window.DataContext>
    <local:RSeriesSourceList/>
</Window.DataContext>


<DockPanel>
    <TabControl ItemsSource="{Binding}">
        <TabControl.ItemTemplate>
            <!--This dictates what goes in the Tab header-->
            <DataTemplate>
                <TextBlock Text="{Binding Title}" />
            </DataTemplate>
        </TabControl.ItemTemplate>
        <TabControl.ContentTemplate>
            <!--This dictates what goes in the tab page-->
            <DataTemplate>
                <s:SciChartSurface RenderableSeries="{Binding RSeries}">
                    <s:SciChartSurface.XAxes>
                        <s:NumericAxis/>
                    </s:SciChartSurface.XAxes>
                    <s:SciChartSurface.YAxes>
                        <s:NumericAxis AutoRange="Always"/>
                    </s:SciChartSurface.YAxes>
                </s:SciChartSurface>
            </DataTemplate>
        </TabControl.ContentTemplate>
    </TabControl>
</DockPanel>
And here is the code-behind for the Data Context
    class RSeriesSource
{
    public String Title { get; set; }
    public ObservableCollection<IRenderableSeries> RSeries{get;set;}
    static Random rnd = new Random(); //for generating example data
    public RSeriesSource()
    {
        RSeries = new ObservableCollection<IRenderableSeries>();
    }
    public static RSeriesSource Example(int n)
    {
        RSeriesSource res = new RSeriesSource();
        res.AddRS(n);
        res.Title = "S" + n.ToString();
        return res;
    }

    FastLineRenderableSeries AddRS(int offset)
    {
        XyDataSeries<Double, Double> Series = new XyDataSeries<Double, Double>();
        for (int ix = 0; ix < 10; ix++)
        {
            Series.Append(offset * 5 + ix, offset + rnd.NextDouble());
        }
        FastLineRenderableSeries res = new FastLineRenderableSeries();
        res.DataSeries = Series;
        //if (yAx != null)
        //    res.YAxisId = yAx.Id; //Use the Id NOT the axis
        RSeries.Add(res);
        return res;
    }
}

class RSeriesSourceList : ObservableCollection<RSeriesSource>
{
    public RSeriesSourceList()
    {
        for (int i = 0; i < 3; i++)
        {
            Add( RSeriesSource.Example(i));
        }
    }
}
- Tony_at_DataH asked 8 years ago
- last active 8 years ago
Hello, first let me say this is a awesome product.
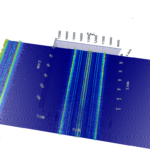
I’m trying to implement sweeping scroll on SciChart. I have read the following article
http://support.scichart.com/index.php?/Knowledgebase/Article/View/17233/37/how-to-create-a-sweeping-ecg-chart
and was able to implement it, but i have one small issue.
First my x axis is TimeSpanAxis, i need ticks to move appropriately. In chart presented with uploaded image, time base of X axis is fixed with VisibleRange from 0-10. I need tick on new trace that comes from left side to add ticks in order like 11-12-13… and old axis to lose oldest ticks like 0-1-2… So when i add new tick on left side trace, oldest tick on right side trace will disapper
Best regards
- Nikola Zoric asked 7 years ago
- last active 7 years ago
For the image in attachement, the user choses which charts he wants to see. How do we align the y-axis labels to the right against the axis?
- Mathias Vanden Auweele asked 7 years ago
- last active 7 years ago
I have a chart that uses datapoint selection on an XyScatterRenderableSeries. This series is defined as follows:
             <s:XyScatterRenderableSeries DataSeries="{Binding ChartData.SinglePointUnavailableResources}"
                                    Stroke="CornflowerBlue"
                                    StrokeThickness="4"
                                    modifiers:FilteringLegendModifier.IncludeSeries="False">
                <s:XyScatterRenderableSeries.PointMarker>
                   <s:EllipsePointMarker Fill="CornflowerBlue" Width="4" Height="4"/>
                </s:XyScatterRenderableSeries.PointMarker>
                <s:XyScatterRenderableSeries.SelectedPointMarker>
                   <s:EllipsePointMarker Fill="Yellow" Width="13" Height="13"/>
                </s:XyScatterRenderableSeries.SelectedPointMarker>
             </s:XyScatterRenderableSeries>
This works as expected, however I am getting broken binding warnings in my debug output window as follows:
System.Windows.Data Warning: 4 : Cannot find source for binding with reference ‘RelativeSource FindAncestor, AncestorType=’SciChart.Charting.Visuals.RenderableSeries.BaseRenderableSeries’, AncestorLevel=’1”. BindingExpression:Path=Opacity; DataItem=null; target element is ‘EllipsePointMarker’ (Name=”); target property is ‘Opacity’ (type ‘Double’)
System.Windows.Data Warning: 4 : Cannot find source for binding with reference ‘RelativeSource FindAncestor, AncestorType=’SciChart.Charting.Visuals.RenderableSeries.BaseRenderableSeries’, AncestorLevel=’1”. BindingExpression:Path=Stroke; DataItem=null; target element is ‘EllipsePointMarker’ (Name=”); target property is ‘Fill’ (type ‘Color’)
System.Windows.Data Warning: 4 : Cannot find source for binding with reference ‘RelativeSource FindAncestor, AncestorType=’SciChart.Charting.Visuals.RenderableSeries.BaseRenderableSeries’, AncestorLevel=’1”. BindingExpression:Path=Stroke; DataItem=null; target element is ‘EllipsePointMarker’ (Name=”); target property is ‘Stroke’ (type ‘Color’)
System.Windows.Data Warning: 4 : Cannot find source for binding with reference ‘RelativeSource FindAncestor, AncestorType=’SciChart.Charting.Visuals.RenderableSeries.BaseRenderableSeries’, AncestorLevel=’1”. BindingExpression:Path=AntiAliasing; DataItem=null; target element is ‘EllipsePointMarker’ (Name=”); target property is ‘AntiAliasing’ (type ‘Boolean’)
You get the same warnings in your “PointMarkers Selection” sample.
They seem to be internal to scichart. I realise this doesn’t effect the functionality, but we generally try and avoid these in our codebase if possible, so ones that do occur are easily spotted and any potential bugs can be identified early.
Is there any way to prevent these warnings coming from scichart?
thanks
Bill
- Bill Dines asked 7 years ago
Is there any way to change the y axis values according to the unit?
For example,
I am plotting the resistance value in Y axis, initially the values were in ohm and suddenly it changes to mega ohm since it is a live graph, then the values which we were shown in ohm should be converted to mega ohm and display in the graph.
Is there is any options available in Scichart in this scenario?
- Sobish Joseph asked 6 years ago
- last active 6 years ago
We’re trying to make multiple legends on the screen, for example, 1 for the left axis and its data series, 1 for the right axis and its data series. I can see it’s possible in the WPF documentation, but in the iOS documentation it says “Coming soon!”. Do we need to wait for a future release of the Xamarin.iOS library or is it possible somehow now?
By the way, I’m not a trial user. We’ve just purchased a license today.
Thanks,
Lazar Nikolov
- Lazar Nikolov asked 5 years ago
- last active 5 years ago
Hello,
This might sound like a newbie question (well it is) but I was wondering how this would work.
We have a application made in python that receives data over ethernet or serial, processes it, saves data in a file and then also shows it either in graph or in value. The GUI also has buttons, drop downs and what not to select IPs, serial COMs and send commands. The problem is some issues on processing the data and customization of graphs (among others).
Scichart seems to allow all this and the idea was to make 1 or more threads for the data receiving/sending and processing and then have the GUI thread.
From the examples it seems like everything must be made in C# is this correct? I am more accustomed to C++ .
- Luís Afonso asked 5 years ago
- last active 5 years ago
I am using SciChart for WPF version 1.3.1.1107 with the MVVM pattern.
I have a chart with several lines and I would like to zoom to extents on just one of the lines. Can you please suggest how I can zoom my chart to the extents of one of several lines that exist in a chart?
- sdemooy asked 12 years ago
Hello,
is there a way to update the X-Axis Values within an XYDataSeries?
What I found was the Update function to update the Y-Values.
https://www.scichart.com/documentation/win/current/webframe.html#SciChart.Charting~SciChart.Charting.Model.DataSeries.XyDataSeries%602~Update.html
But I can’t figure out how to update the X Values of the DataSeries.
The XyzDataSeries3D does support the functionality to update also the X Value.
https://www.scichart.com/documentation/win/current/webframe.html#SciChart.Charting3D~SciChart.Charting3D.Model.XyzDataSeries3D%603~Update.html
But for the NonUniformGridDataSeries3D I can’t figure out how to update any point.
Maybe I am missing something, just let me know.
Best Regards,
Nick
- Nick Müller asked 4 years ago
- last active 4 years ago
Hi all, me again !
I’m looking for inverting the Y axis. I want to make a chart which chronology goes from top to the bottom. I don’t see any property that talks about this and there is no example showing that kind of feature. Is it possible to do ?
Thank you
- Chaos asked 11 years ago
Hi
I would like to do some logic after zooming in but can not find to witch event I should subscribe or overwrite ?
- Unisense A/S Tueager asked 11 years ago
SciChart 3.1.0.5175
iOS 13.5
Xcode 10.15.5
If I am using the API incorrectly please let me know. I am not aware of any requirement to wait after using the SciChart API.
It appears the SCILegendModifier has some kind of timing bug. If you draw a chart on a surface with a legend, then clear the chart, then add another plot to the same surface you will notice the legend has stale data. However, if you clear the surface and wait a second before you add the new plot it will work as expected.
I created a sample Xcode project to demonstrate the issue. See the attachment chart.zip
I also created a video to demonstrate the issue: https://youtu.be/1JBTd1sfVgI
I have a workaround so this is not urgent, but I would like to remove the delay for my production release.
- Michael Chartier asked 4 years ago
- last active 4 years ago
What would be the easiest way of changing the zero line on a mountain chart?
I am plotting seabed elevations along a particular route. These values are always negative. Rather than shading the area above the dataseries (up to a value of 0) I would like to the shading to happen below the series (up to a specified negative value, which I would set to a depth well below my deepest point).
I have considered:
+ shifting my data points and working with a custom label formatter
+ swapping chart surface background and mountain area colours, but then the gridlines appear on the wrong side of the series
I noticed from the documentation that there is a zeroCoord parameter in the protected RenderMountainArea method, but I’m not sure how to best override it…
Any suggestions?
- Jelle Muylle asked 10 years ago
- last active 10 years ago
Hello!
I’ m working with big number of annotations. They’re creating an image of earth section profile. We need to recreate them everytime, when visible range changed. For these purposes we use MouseWheelZoom and ZoomPanModifier. And when go to another region of our image or zoom it,it flickers. I had a thought that the problem was that I deleted all annotations and the duration between deleting old and creating new was that flicker. I rewrited the code so he added annotation at first and then deleted old annotations. Here is it:
            foreach (var mainSectLine in mainSectLines)
            {
                Color tempColor = new Color();
                double temp = mainSectLine.val/maxValueForPainting;
                if (temp < 0.2) tempColor = Colors.Blue;
                else
                {
                    if (temp < 0.4) tempColor = Colors.Green;
                    else
                    {
                        if (temp < 0.6) tempColor = Colors.Yellow;
                        else
                        {
                            if (temp < 0.8) tempColor = Colors.Orange;
                            else
                            {
                                tempColor = Colors.Red;
                            }
                        }
                    }
                }

                var tempBrush = new SolidColorBrush(tempColor);
                if (tempBrush.CanFreeze)
                {
                    tempBrush.Freeze();
                }
                LineAnnotationItem lineAnnotation = new LineAnnotationItem()
                {
                    Index = Index,
                    X1 = mainSectLine.THL1,
                    X2 = mainSectLine.THL2,
                    Y1 = -mainSectLine.TVD1,
                    Y2 = -mainSectLine.TVD2,
                    YAxisId = textOfYAxis,
                    Stroke = tempBrush,
                    AnnotationCanvas = AnnotationCanvas.BelowChart,
                };
                AnnotationCollection.Add(lineAnnotation);
            }
            List<IAnnotation> annotationsToDelete =
                AnnotationCollection.Where(q => q.GetType() == typeof (LineAnnotationItem)&&((LineAnnotationItem)q).Index==Index-1).ToList();
            foreach (IAnnotation annotation in annotationsToDelete)
            {
                AnnotationCollection.Remove(annotation);
            }
But that does not make a sense. So it also took a lot of time to detach and attach annotations. To solve that trouble, I rewrited function:
List<IAnnotation> annotations =
                AnnotationCollection.Where(q => q.GetType() != typeof (LineAnnotationItem)).ToList();
            AnnotationCollection tempAnnotationCollection=new AnnotationCollection();
            foreach (var mainSectLine in mainSectLines)
            {
                Color tempColor = new Color();
                double temp = mainSectLine.val/maxValueForPainting;
                if (temp < 0.2) tempColor = Colors.Blue;
                else
                {
                    if (temp < 0.4) tempColor = Colors.Green;
                    else
                    {
                        if (temp < 0.6) tempColor = Colors.Yellow;
                        else
                        {
                            if (temp < 0.8) tempColor = Colors.Orange;
                            else
                            {
                                tempColor = Colors.Red;
                            }
                        }
                    }
                }

                var tempBrush = new SolidColorBrush(tempColor);
                if (tempBrush.CanFreeze)
                {
                    tempBrush.Freeze();
                }
                LineAnnotationItem lineAnnotation = new LineAnnotationItem()
                {
                    Index = Index,
                    X1 = mainSectLine.THL1,
                    X2 = mainSectLine.THL2,
                    Y1 = -mainSectLine.TVD1,
                    Y2 = -mainSectLine.TVD2,
                    YAxisId = textOfYAxis,
                    Stroke = tempBrush,
                    AnnotationCanvas = AnnotationCanvas.BelowChart,
                };
                tempAnnotationCollection.Add(lineAnnotation);
            }
            AnnotationCollection = tempAnnotationCollection;
            foreach (IAnnotation annotation in annotations)
            {
                AnnotationCollection.Add(annotation);
            }
But there are still flickers when pan or zoom, but it works a bit faster.
So how can I eliminate these flickers? What can I do to speed up adding and deleting annotations?
- ilyas asked 10 years ago
Hi
I want to override the default AxisLabelTemplate for a DateTimeAxis beyond the normal circumstances.
Setting the AxisLabelTemplate to a StaticResource is easy enough, but all I have inside the Template is the CursorFormattedDataValue and I want to be able to send in something more then a simple string.
<ControlTemplate x:Key="RolloverModifierAxisLabelTemplateDefault">
    <Border Background="LightGray"
            Opacity="0.80"
            BorderThickness="0"
            CornerRadius="5"
            Padding="2"
            Visibility="{Binding IsXAxis, Converter={StaticResource BoolToVisibilityConverter}}">
        <TextBlock Text="{Binding CursorFormattedDataValue}" />
    </Border>
</ControlTemplate>
Extending the LabelProviderBase gives me the opportunity to override the FormatCursorLabel method, but it only returns a string and not an object and therefore I can not pass my own data structure to be used inside the AxisLabelTemplate.
How can we solve this issue? Is there a workaround, or is this something you need to implement?
- Sander Struijk asked 10 years ago
- last active 9 years ago
Hi,
I have some questions about the vertical slice modifier.
1: I have a scrollbar surface that is always visible and numerous tabs with numerous charts. The scrollbar binds to a common shared x visible range property. I have a vertical slice on the underlying surface that shares a common X1 binding to all the other charts too. The problem is that the scrollbar is over the top of the vertical slice, making it impossible to drag from the master surface. Is there a way to bring this to the front?
    <s:SciChartSurface.XAxis>
        <s:NumericAxis x:Name="AxisX" TextFormatting="0" DrawMajorGridLines="False" DrawMinorGridLines="False" DrawMajorBands="False" Visibility="Visible" AutoRange="Always"/>
    </s:SciChartSurface.XAxis>

    <s:SciChartSurface.YAxis>
        <s:NumericAxis DrawMajorGridLines="False" DrawMinorGridLines="False" DrawMajorBands="False" AutoRange="Always" Visibility="Collapsed"/>
    </s:SciChartSurface.YAxis>

    <s:SciChartSurface.ChartModifier>
        <s:ModifierGroup>
            <s:VerticalSliceModifier Name="sliceModifier" ShowTooltipOn="Never">
                <s:VerticalSliceModifier.VerticalLines>
                    <s:VerticalLineAnnotation Style="{StaticResource sliceStyle}" X1="{Binding SlicePosition, Mode=TwoWay}"/>
                </s:VerticalSliceModifier.VerticalLines>
            </s:VerticalSliceModifier>

        </s:ModifierGroup>
    </s:SciChartSurface.ChartModifier>

</s:SciChartSurface>

<s:SciChartScrollbar x:Name="scrollOverview"
                     Grid.Column="0"
                     Grid.Row="2"
                     Height="30"
                     Margin="0,0,0,20"
                     Axis="{Binding Source={x:Reference Name=AxisX}}"
                     Style="{StaticResource ScrollbarStyle}"
                     SelectedRange="{Binding SharedXVisibleRange, Mode=TwoWay, UpdateSourceTrigger=PropertyChanged}">

</s:SciChartScrollbar>
2: I’m using a legend modifier that shows the latest live FormattedYValue for the series. This works great while it’s live but when I stop the data input and use vertical slive, is there a way to inject the y value of the vertical slice position into the legend value?
Currently I’m hiding the live values and showing the vertical slice tooltip instead which I feel is a little too messy for my liking. I’d rather just update the legend value.
<Grid.ColumnDefinitions>
</Grid.ColumnDefinitions>
        <!--  Binds to SeriesInfo.IsVisible to show and hide the series  -->
        <CheckBox Grid.Column="0"
                  HorizontalAlignment="Left"
                  VerticalAlignment="Center"
                  Foreground="{Binding Stroke, Converter={StaticResource ColorToBrushConverter}}"
                  IsChecked="{Binding IsVisible, Mode=TwoWay}"
                  Style="{StaticResource DataSeriesCheckBoxStyle}"
                  />

        <!--  Series name (SeriesInfo.SeriesName)  -->
        <TextBlock Grid.Column="1"
                   MinWidth="70"
                   Margin="2,0,0,0"
                   HorizontalAlignment="Left"
                   VerticalAlignment="Center"
                   Text="{Binding SeriesName}"
                   FontSize="10"
                   Foreground="{Binding Stroke, Converter={StaticResource ColorToBrushConverter}}"
                   />

        <!--  Live Value  -->
        <TextBlock Grid.Column="2"
                  Margin="10,0,5,0"
                  HorizontalAlignment="Right"
                  VerticalAlignment="Center"
                  FontSize="10"
                  Text="{Binding FormattedYValue}"
                  Foreground="{Binding Stroke, Converter={StaticResource ColorToBrushConverter}}"
                  Visibility="{Binding RelativeSource={RelativeSource AncestorType={x:Type UserControl}}, Path=DataContext.ShowLiveValues, Converter={StaticResource BooleanToVisibilityConverter}}"
                   />

    </Grid>
</DataTemplate>
3: Is there a way that a single click on a surface could make the vertical slice jump to the click position? I’d also like to be able to double click drag the zoom/pan modifier instead of single click drag.
Thanks in advance,
Declan.
- Declan Walsh asked 2 years ago
- last active 2 years ago
Hi,
i’ve a Example as Screenshot. What i want to do is to draw and move two Lines on Scichart and draw the difference between the two Lines on an Arrow.
Did anyone know a possibility to do this ?
Thanks in Advance
- Manuel Held asked 9 years ago
- last active 9 years ago
We have implemented majorTick to make the x-axis only show the more important time, but we still have some problems that cannot be solved
-
The inter-day tick has been added to the majorTick, but it still often cannot be displayed. We need to display the inter-day tick first, not the last majorTick of the previous day
-
Even though I zoomed in to the enough width, it seems that the label of the cross-day tick is still not displayed. I can’t find the reason.
The following is a schematic video:
https://youtu.be/GklhvOo4dr4
Is there a way to make the specified tick/xValue/index have a higher display priority?
Thank you very much for your help
- chinghung lai asked 2 years ago
Is there an easy way to rotate the Chart(swapping X and Y-Axis) inclusive Annotations, Modifiers,…?
- Daniel Hartl asked 9 years ago
- last active 9 years ago
I’ve created a chart that generates a System.AccessViolationException every time it runs.
I’ve attached the minimal reproduction I could come up with. It seems to be related to the combination of a FastLineRenderableSeries with:
StrokeDashArray = new[] { 2.0, 2 },
IsDigitalLine = true
DataSeries with UserDefinedDistributionCalculator with ContainsNaN = true
because any other combination of those properties and it does not crash.
- Eamon asked 2 years ago
- last active 2 years ago
Hi. I’m trying to add 3DChart to my vue project. And I have a question about the configuration. Can I download .data and .wasm files from the CDN.
For 2D charts , I’ve used recomendation of your release v.2.2:
SciChartSurface.useWasmFromCDN()
It works for me. How I can use CDN for SciChart3DSurface?
- Volodymyr Stoyanovskyy asked 2 years ago
- last active 2 years ago
Hi All,
Newby question here – we’re just getting our heads around SciChart at the moment so please bear with me.
Having acquired our data the chartSurface is populated using a RenderableSeries with an XyDataSeries consisting of DateTime/double datapairs. Everything is fine and we can do lots of panning and zooming etc.
The problem comes when I attempt to put a VerticalLineAnnotation on the graph on a response from a mouseclick (as per the example code). When I attempt to get coordinate calculator with
var coordinateCalculator = this.sciChartSurface.XAxis.GetCurrentCoordinateCalculator();
It throws an exception as XAxis is null!
Can someone explain what we are missing or point us in the right direction in general.
Thanks in advance
/Stu
- Stuart McCullough asked 9 years ago
- last active 9 years ago
Hi,
I would like to synchronize zooming and scrolling between two or more charts. I would like to do it without using xaml. Can this be done?
- jj asked 9 years ago
- last active 5 years ago
Hi,
I have used WPF Chart Vertically Stacked YAxis example:
WPF Chart Vertically Stacked YAxis | Fast, Native, Charts for WPF (scichart.com)
and WPF Chart Multiple YAxis example:
WPF Chart Multiple YAxis | Fast, Native, Charts for WPF (scichart.com)
I have managed to achieve both individually but now essentially I would like to combine them.
I have been trying to alter the Right Axes Panel Template to allow this but it seems to only allow one or the other.
My main difference from the examples is that I have a collection of Yaxes of NumericAxisViewModel type in my viewmodel that is decided by the user at runtime before creating the chart and so is not defined in the xaml and bound with the YAxes property on the surface using AxesBinding.
I want to be able to vertically stack some of the Yaxes and have the rest stack horizontally side by side on the same axis alignment side, in my case the right side.
Is this something that is possible? If so how do I achieve this?
Let me know if you need any more info.
Cheers,
Grahame
- Grahame Hall asked 2 years ago
- last active 2 years ago
I am using the MouseWheelZoomModifier and ZoomExtentsModifier on the line chart. Beside double clicking the chart area to Zoom Extents the chart, I would like to add a button outside the chart and this button will trigger the Zoom Extents. Is it possible to do it?
- Kelly Chan asked 1 year ago
- last active 1 year ago
Hi,
Is it possible to use non .Net types in a DataSeries?
I need to use complex types like this…
XyDataSeries<DateTime, ComplexTypeObject>
I need to store additional property to a series point, Is it possible? or is there a different way of doing it.
I tried doing it like this
public class DataValue : ISeriesPoint<double>, IComparable
but it doesn’t work.
Thanks,
Benjamin
- Benjamin de Ocampo asked 9 years ago
- last active 9 years ago
I download the iOS library via cocoapods. Today running ‘pod update’ results in the error below. It seems the ZIP file is not available on the server.
Installing SciChart 4.4.1.5847 (was 4.4.1.5840)
[!] Error installing SciChart
[!] /usr/bin/curl -f -L -o /var/folders/mr/0skn4y5d1t99bcvzd09g_wdr0000gn/T/d20221217-6770-1dkgzs/file.zip https://github.com/ABTSoftware/PodSpecs/releases/download/v4.4.1.5847/SciChart_iOS_4.4.1.5847.zip --create-dirs --netrc-optional --retry 2 -A 'CocoaPods/1.11.3 cocoapods-downloader/1.6.3'

curl: (22) The requested URL returned error: 404
I tried to download the zip file manually and it failed. When I modified the URL to download the previous release (4.4.1.5840) it worked.
- Michael Chartier asked 1 year ago
- last active 1 year ago
How do I change the selection marker of an annotation? It seems to default to green squares of a certain size, which is all I can find in your examples. I tried to search the knowledgebase and forums but could not seem to find this answer. I would like to be able to control the color, shape, and size of the selection indicators for each annotation in my chart.
Thanks.
- Matt Machalinski asked 9 years ago
- last active 9 years ago
