I updated schichart to the very last version and turn on the memory usage debug mode to see if there are any memory leaks in our application and ran into the following problem.
When MemoryUsageHelper.isMemoryUsageDebugEnabled = true; and sciChartSurface has the following modifiers(RolloverModifier, CursorModifier) when moving the mouse over the chart I have the following console warnings.
From RolloverModifier instance

From CursorModifier instance

The message below is written on your docs about debugging, so I gues this is the case with the chart modifiers console warnings.
Usually this boils down to failing to call SciChartSurface.delete() (or series.delete(), annotation.delete() when adding/removing objects) or plain JavaScript memory leaks where references to SciChart are held in the customer application & not garbage collected by the browser.
Steps To Reproduce
- Follow the codesandbox example by the link https://codesandbox.io/s/ts-band-chart-xwlxcm?file=/src/App.tsx;
- Once the chart is loaded and rendered, try moving the mouse cursor over the chart;
- Open the browser console ⇒ You will see the warnings I wrote about above.
The current behavior
Moving the mouse over the chart causes warning logs to appear in the browser console and possibly memory leaks.
The expected behavior
No warning logs while moving the mouse over the chart.
- Sergey Chernyakov asked 8 months ago
- last active 8 months ago
I am considering applying server-side licensing for my javerScript application.
In the document below, there is a phrase “Our server-side licensing component is written in C++.”
(https://support-dev.scichart.com/index.php?/Knowledgebase/Article/View/17256/42/)
However, there is only asp.net sample code on the provided github.
(https://github.com/ABTSoftware/SciChart.JS.Examples/tree/master/Sandbox/demo-dotnet-server-licensing)
I wonder if there is a sample code implemented in C++ for server-side licensing.
Can you provide c++ sample code?
Also, are there any examples to run on Ubuntu?
- Simon Molino asked 8 months ago
On graphs with many axes it can often be difficult to read as the tics don’t line up with grid-lines.
What I would like to try is having a fixed number of grid lines (either a set number or based on the size of the graph) and then having all axis ticks aligned with the grid. To make the ticks human friendly I would then want to slightly zoom out each axis so that tics become nice numbers.
I am imagining it would also need to slightly adjust the zoom levels each time user interactions interact with the graph, i.e. if the user was to use a rubberband modifier to zoom in, I would expect I would need to hook in somehow to zoom out very slightly to get nice numbers on the tics, as they can no longer float about to nice values.
Is there any easy way I could experiment with something like this.
- Hugoagogo asked 8 months ago
- last active 6 months ago
Setting VisibleRange in xaml or in code behind does not seem to work. It always defaults to (0.1, 100)
 <s:SciChartSurface x:Name="positiveScaleChart"
                    Loaded="OnLogarithmicAxisViewLoaded">

     <s:SciChartSurface.RenderableSeries>
         <s:FastLineRenderableSeries />
     </s:SciChartSurface.RenderableSeries>

     <s:SciChartSurface.XAxis>
         <s:NumericAxis TextFormatting="0"
                        VisibleRange="0, 100"
                        AutoRange="Never" />
     </s:SciChartSurface.XAxis>

     <s:SciChartSurface.YAxis>
         <s:LogarithmicNumericAxis AxisAlignment="Left"
                                   TextFormatting="0"
                                   AutoRange="Never"
                                   VisibleRange="-1, 10000">

         </s:LogarithmicNumericAxis>
     </s:SciChartSurface.YAxis>
 </s:SciChartSurface>


 public partial class LogarithmicAxisView : UserControl
 {
     public LogarithmicAxisView()
     {
         InitializeComponent();
     }

     private void OnLogarithmicAxisViewLoaded(object sender, RoutedEventArgs e)
     {
         var posDataSeries0 = new XyDataSeries<double, double>();

         var data1 = new DoubleSeries();

         for (int i = 0; i < 100; ++i)
         {
             data1.Add(new XYPoint() { X = i, Y = Math.Pow(i, 3) });
         }

         posDataSeries0.Append(data1.XData, data1.YData);
         positiveScaleChart.RenderableSeries[0].DataSeries = posDataSeries0;
         positiveScaleChart.YAxis.VisibleRange = new DoubleRange(-1, 10000);
     }
 }
- Ben Green asked 8 months ago
- last active 8 months ago
We’re currently using the DataPointSelectionModifier which works great, however, we need some slight tweaks to it’s behaviour
- The ability to disable marquee selection on demand (whilst still being able to multi select points by clicking each point)
- Swap the Ctrl/Shift key combos
I was wondering if the source for the DataPointSelectionModifier could be made available for people to adapt to suit their needs? else it means trying to create it from scratch.
Perhaps you could post it in an area that only customers could access?
- Ben Green asked 8 months ago
- last active 7 months ago
Hi,
I am facing a issue with latest version of SciChart. Because of this type error not able to build the project. Can you check this error.
- Mathew George asked 8 months ago
- last active 8 months ago
Hello,
I’m relatively new to SciChart and I’m facing a challenge with customizing the appearance of a dynamically created series that is bound to a SciChartSurface using SeriesBinding in WPF.
I have a VerticalSliceModifier in my XAML where I define a VerticalLineAnnotation. My series is created in code as a MountainRenderableSeriesViewModel and then bound to the chart using SeriesBinding. Here’s the relevant code snippets:
<s:SciChartSurface
    Grid.Row="1"
    Background="Transparent"
    BorderThickness="0"
    RenderableSeries="{s:SeriesBinding Series}"
    Annotations="{s:AnnotationsBinding Annotations}">

    <s:VerticalSliceModifier ShowTooltipOn="Never" Foreground="White" Name="sliceModifier">
        <s:VerticalSliceModifier.VerticalLines>
            <s:VerticalLineAnnotation X1="{Binding Number}" Style="{StaticResource sliceStyle}" />
        </s:VerticalSliceModifier.VerticalLines>
    </s:VerticalSliceModifier>

</s:SciChartSurface>


public class MountainRenderableSeriesViewModel
{
    public DataSeriesViewModel<double, double> DataSeries { get; set; }
    public DataTemplate RolloverMarkerTemplate { get; set; }
    // Other properties...

    public MountainRenderableSeriesViewModel()
    {
        // Initialize your DataSeries and other properties

        // Set the RolloverMarkerTemplate for this series
        RolloverMarkerTemplate = Application.Current.Resources["CustomRolloverMarkerTemplate"] as DataTemplate;
    }
}
My challenge is that I want to customize the RolloverMarkerTemplate for this dynamically created series. Most of the examples I’ve found show how to use RolloverMarkerTemplate with a statically defined series, but I cannot figure out how to assign it when the series is created in a ViewModel and bound to the chart using SeriesBinding.
Any guidance or code examples on how to achieve this customization would be greatly appreciated.
- Eira Jeremy asked 8 months ago
- last active 6 months ago
Hi,
I’m using SciChart for macOS (v4.4.2.5871 installed via CocoaPods) and one thing that I tried was to implement the an axis to show full extent of data, as described in the first bullet of https://www.scichart.com/documentation/ios/current/axis-ranging—get-or-set-visiblerange.html#zooming-to-fit-all-the-data
However, what I’m getting is that after setting the visibleRange to match the dataRange, the dataRange no longer reflects the “true” range, but something else. Also “zoom to extent” no longer works
Attached is a super basic example (project) for this. To reproduce, do the following:
- Do a zoom (via pinch)
- Click the button titled “Set visibleRange to dataRange” -> this step works as expected
- Do a zoom
- Click again the button -> “zoom to extent” no longer works,
dataRangeis messed up
- Vlad Badea asked 8 months ago
- last active 8 months ago
Hi,
I’m using SciChart for macOS (v4.4.2.5871 installed via CocoaPods) and I’m trying to restrict the X axis’ visibleRange as described in https://www.scichart.com/documentation/ios/current/axis-ranging—restricting-visiblerange.html but what I’m getting is the app hanging so badly that even “Pause program execution” doesn’t work (I need to “Stop the running scheme or application”).
The sample code for this issue is super basic and is attached to this ticket, but in a nutshell the lines causing issues are:
xAxis.visibleRangeChangeListener = { axis, oldRange, newRange, _ in
    if newRange.minAsDouble < -10 {
        axis.visibleRange = oldRange
    }
}
The scenario to reproduce the problem is to pan until you hit -10 on X axis.
Let me know if I’m missing something obvious or if this is indeed an issue.
P.S. I have one more problem with setting the visibleRange , but I will open a different ticket because the behavior is different.
- Vlad Badea asked 8 months ago
- last active 8 months ago
I’m trying to add an AxisMarkerAnnotations for some line series on my chart.
I was following these questions answered here:
https://www.scichart.com/questions/js/adding-axis-markers-to-fastlinerenderableseries
https://www.scichart.com/questions/js/price-indicators-on-yaxis
I managed to render the axis marker for my series. Now I’m trying to the set the Y value of the marker annotation as the value where the line intersects the Y Axis.
I want the marker value to be the last value of the series, only if the xAxis.visibleRange.max > series.XdataRange.max.
The two attached images show the desired feature.
One shows the marker annotation with the Y1 being the one where the line intersects the YAxis.
The other shows the marker annotation with the Y1 being the last value of the line, because it is visible.
I read some answers here on the forum about using the HitTest API to do this, but I couldn’t make it work on my JS app
- Lucas Lucafó asked 8 months ago
- last active 8 months ago
Hello.
I have a XYRenderableDataSeries with point markers with a fill color.
I also have a DataPointSelectionModifier which allows me to select clusters up to 5 from the series.
I want that when I select a cluster from the series, the points selected from the series should be colored for that specific cluster. i.e. all the cluster colors should be different. Also, when I select another cluster, the colors in the points selected from 1st cluster or other clusters should be preserved.
Here’s the XAML code :
<s:XyScatterRenderableSeries DataSeries="{Binding ScatterData}">
                    <s:XyScatterRenderableSeries.PointMarker>
                        <s:EllipsePointMarker  Width="3" Height="3" Fill="#AAFFFFFF" Stroke="SteelBlue" StrokeThickness="2"/>
                    </s:XyScatterRenderableSeries.PointMarker>
                    <s:XyScatterRenderableSeries.SelectedPointMarker>
                        <s:EllipsePointMarker Fill="{Binding ClusterColor, Mode=TwoWay}"
                                              Width="12"
                                              Height="12" />
                    </s:XyScatterRenderableSeries.SelectedPointMarker>
                </s:XyScatterRenderableSeries>

<s:SciChartSurface.ChartModifier>
                <s:ModifierGroup>
                    <s:DataPointSelectionModifier Name="PointMarkersSelectionModifier"
                                                  IsEnabled="{Binding IsManualClustering}"
                                                  SelectionChanged="PointMarkersSelectionModifier_SelectionChanged"
                                                  SelectionFill="#B1B5B2B2"
                                                  SelectionStroke="#009E9C9C" />
                    <s:MouseWheelZoomModifier IsEnabled="True" />
                    <s:RubberBandXyZoomModifier IsEnabled="False" />
                </s:ModifierGroup>
            </s:SciChartSurface.ChartModifier>
I tried to find examples but could not find any. Please let me know if we can reach a solution to this in some way.
Thank you.
- Ammar Khan asked 8 months ago
- last active 7 months ago
Hi, I want to create info boxes between xAxis and chart, info box will contain text, but the width/position of the box will be base on the xAxis and should sync with the chart (zoom etc). For example, if xAxis is from 1-100, and the first info box start from 1 to 10, then the width/position of the box should cover from 1-10, and if I zoom between 1-10, then info box should also sync and expand.
So far, I have created it using horizontal stacked xAxes and custom axis layout strategy provided by you. But the issue is that the stacked xAxes are not sync with the chart, for now, to make it seem sync, I am recalculating stacked axis length when zoom. But the issue comes when there should be gap between the info boxes, for example, if xAxis is 1-100 and the first box is 1-10 and the second box is 20-40, then there is a gap of 10 between the first and second. Right now, those gap are filled using empty xAxes, but they are not correct. When there is gap, the position of the boxes are wrong.
- First image is my current implementation of it using custom axis layout and stacked xAxes.
- Second image is how it look when zoomed
- Third image is the gap issue with the current implementation
- Fourth image is how the correct implementation should look like.
Codesanbox example:
https://codesandbox.io/s/scichart-stacked-xaxis-stacked-length-issue-3knt23?file=/src/App.tsx
- Nung Khual asked 8 months ago
- last active 8 months ago
We are using the VerticalLineAnnotation and want to change it’s location (X1 property) in the viewmodel.
Annotations are bound like this:
<s:SciChartSurface
           ...
           Annotations="{s:AnnotationsBinding Annotations}"
to the property:
public ObservableCollection<IAnnotationViewModel> Annotations { get; private set; }
The collection contains this association:
this.nowAnnotation = new VerticalLineAnnotationViewModelEx()
        {
            X1 = TimeSpan.FromSeconds(0),
            StyleKey = "NowAnnotationStyle"
        };
To change the location we change the value of X1:
nowAnnotation.X1 = value;
Calling that didn’t have a direct effect on the UI unless the user does any action which redraws the chart.
We created a style which sets an attached property to pass the VerticalLineAnnotation to the view model, this works fine.
<Style TargetType="s:VerticalLineAnnotation" x:Key="NowAnnotationStyle">
                    <Setter Property="viewModels:VerticalLineAnnotationViewModelEx.PassIAnnotation" Value="True" />
                </Style>
And we added a Refresh method to VerticalLineAnnotationViewModelEx and call it after setting X1:
nowAnnotation.X1 = value;
nowAnnotation.Refresh();
The first implementation of the Refresh method we did was:
public void Refresh()
    {
        this.Annotation.Refresh();
    }
From the documentation this should redraw the annotation without redrawing the whole chart, but it had no effect.
https://www.scichart.com/documentation/win/current/webframe.html#SciChart.Charting~SciChart.Charting.Visuals.Annotations.AnnotationBase~Refresh.html
It only started working after changing to this:
public void Refresh()
    {
        this.Annotation.ParentSurface.InvalidateElement();
    }
Is there a better way to do it, shouldn’t the first implementation work?
The complete code of VerticalLineAnnotationViewModelEx
public class VerticalLineAnnotationViewModelEx : VerticalLineAnnotationViewModel
{
    public static readonly DependencyProperty PassIAnnotationProperty = DependencyProperty.RegisterAttached(
        "PassIAnnotation", typeof(bool), typeof(VerticalLineAnnotationViewModelEx),
        new PropertyMetadata(default(bool), OnPassIAnnotationChanged));

    public IAnnotation Annotation { get; private set; }

    private static void OnPassIAnnotationChanged(DependencyObject d, DependencyPropertyChangedEventArgs e)
    {
        var verticalLineAnnotation = (VerticalLineAnnotation)d;
        ((VerticalLineAnnotationViewModelEx)verticalLineAnnotation.DataContext).Annotation = (IAnnotation)d;
    }

    public static void SetPassIAnnotation(DependencyObject element, bool value)
    {
        element.SetValue(PassIAnnotationProperty, value);
    }

    public static bool GetPassIAnnotation(DependencyObject element)
    {
        return (bool)element.GetValue(PassIAnnotationProperty);
    }

    public void Refresh()
    {
        //this.Annotation?.Refresh();
        this.Annotation?.ParentSurface.InvalidateElement();
    }
}
- AC42admin LMB asked 8 months ago
- last active 7 months ago
Hi~
How to create dotted line cursor like a dashed line curve?
Thanks.
- kim2 kim asked 8 months ago
- last active 7 months ago
I have created a demo app with the relevant code.
I have a tab control with 2 tabs, each one with a version of the SciChart surface showing multiple graphs stacked on top of each other.
The first (LAT) uses the standard WPF ListBox with each item contains a surface.
The second (ECG) uses a vertically stacked YAxis (from the customer examples).
Scenario
Select the second tab (ECG).
Press the Create button to create 50 waveforms.
(note – only a single graph is created)
Select the first tab, then select the 2nd tab.
(all 50 graphs are created)
HELP
I am unable to upload the .zip file (with the demo) or an images.
I select the file – but it does not upload
- Craig Wooldridge asked 8 months ago
- last active 8 months ago
Hi, I have an issue where I am trying to create multiple xAxes where one is normal and the rest are horizontally stacked. Then I calculate the stacked length of each stacked axes, but the issue comes when I change the width of the chart or inspect element, which would alter the width of the chart somehow, I got error saying the total width of the stacked axes is bigger than available size.
I have a codesanbox example of it:
https://codesandbox.io/s/scichart-stacked-xaxis-stacked-length-issue-3knt23?file=/src/App.tsx
I am using percentage for the stacked xAxes length and then I added them up to be 100% total, but somehow it is saying that it is more than available size.
So, my question is, how can I listen or get the width/size changes event of the chart/xAxis, so that I can calculate accordingly?
- Nung Khual asked 8 months ago
- last active 8 months ago
I have a color heatmap legend that need to update the yAxis range on the fly. The colorMap doesn’t update as expected. Here’s my codes to update the y axis and colorMap min/max of the heatmap legend:
const newRange = new NumberRange(newMin, newMax);
const yAxis = heatmapLegendRef.current.sciChartSurface.yAxes.items[0];
yAxis.majorDelta = newScale;
yAxis.minorDelta = newScale / 5;
yAxis.visibleRange = newRange;
yAxis.visibleRangeLimit = newRange;
yAxis.zoomExtentsRange = newRange;

colorMapRef.current.minimum = newMin;
colorMapRef.current.maximum = newMax;
heatmapLegendRef.current.colorMap = colorMapRef.current;
The y axis range has been updated. But the colorMap didn’t. It seems that the colorMap of the heatmap legend cannot be changed. Is it true that I can only recreate the heatmap legend if I want to change the colorMap?
- Quyen Sy asked 8 months ago
- last active 8 months ago
Code changes :
– Grab the SciChart_ScatterChart example
 <s:SciChartSurface Name="sciChart"
                Grid.Column="1"
                Padding="0"
                BorderThickness="0">

 <s:SciChartSurface.RenderableSeries>
     <s:XyScatterRenderableSeries x:Name="scatterRenderSeries0"
                                  Opacity="0.67">
         <s:XyScatterRenderableSeries.PointMarker>
             <s:EllipsePointMarker Width="14"
                                   Height="14"
                                   Fill="{StaticResource PointMarkerFillColor}"
                                   StrokeThickness="0" />
         </s:XyScatterRenderableSeries.PointMarker>
     </s:XyScatterRenderableSeries>
 </s:SciChartSurface.RenderableSeries>

 <s:SciChartSurface.XAxis>
     <s:NumericAxis DrawMajorBands="True"
                    GrowBy="0.1, 0.1"
                    VisibleRangeLimit="0, 0"
                    VisibleRangeLimitMode="Min" />
 </s:SciChartSurface.XAxis>

 <s:SciChartSurface.YAxis>
     <s:NumericAxis DrawMajorBands="True"
                    GrowBy="0.1, 0.1"
                    VisibleRangeLimit="0, 0"
                    VisibleRangeLimitMode="Min" />
 </s:SciChartSurface.YAxis>

 <s:SciChartSurface.ChartModifier>
     <s:ModifierGroup>
         <s:ZoomPanModifier ClipModeX="ClipAtMin" />
         <s:MouseWheelZoomModifier />
     </s:ModifierGroup>
 </s:SciChartSurface.ChartModifier>
Repro steps :
- Zoom out using the wheel
- Try to pan
- Notice that it appears to apply an unwanted zoomToExtents operation
Can I also ask why there is still no ClipModeY for the ZoomPanModifier? there are a few posts relating to this with workarounds, but none of them seem to work as far as I can tell without weird side affects.
- Ben Green asked 8 months ago
- last active 8 months ago
I’m trying to add a axis label/marker to the yAxis of my chart.
This label should follow the intersection between a FastLineRenderableSeries (that i’m using to render a moving average filtered dataSeries) and the yAxis.
I tried to extend the “draw” method of the FastLineRenderableSeries to draw a label ontop of the yAXis, using the “drawModifiersAxisLabel” helper function. Like:
class CustomFastLineRenderableSeries extends FastLineRenderableSeries {
draw(renderContext: WebGlRenderContext2D, renderPassData: RenderPassData) {
    super.draw(renderContext, renderPassData)
    const yAxis = getYAxis(this.parentSurface);
    drawModifiersAxisLabel(
        yAxis,
        renderContext,
        150, // testing values
        "#00ff00", // testing values
        "#00ff00", // testing values
    );
}
but the label don’t get drawn.
The attached image shows the desired feature (image from another charting lib)
How can I implement this?
- Lucas Lucafó asked 8 months ago
- last active 8 months ago
Hi,
I am creating an application where, we fetch data and display it in multiple heatmaps. The user can manipulate the heatmaps with changing colormap or changing ranges on the colormap.
Data from these multiple heatmaps is composited to another chart for visualization.
I was able to get a reference to the series, but adding the series to another chart errors with a message:
Invalid operation in sciChartSurface.attachSeries, this series has already been attached to a SciChartSurface. Please detach it from a SciChartSurface before attaching to another

at BaseRenderableSeries.onAttach (BaseRenderableSeries.js:634:1)

at __webpack_modules__../node_modules/scichart/Charting/Visuals/SciChartSurface.js.SciChartSurface.attachSeries (SciChartSurface.js:1385:1)
of course this means we cannot attach the same series to two different charts, but is there a way around this such as deepcloning?
renderable series: attached image
sample code: attached image
- pramod butte asked 8 months ago
- last active 8 months ago
I’m experimenting with creating a CustomRenderableSeries.
I was expecting VisualXcceleratorRenderSurface to perform the fastest. But what I am finding is that it is noticeably slower than XamlRenderSurface. By slower, I mean interaction with zoom/pan becomes choppy and resizing the window is choppy. Which is surprising because I’m really not rendering much at all.
We plan on rendering a lot more than this, but it already appears to struggling. Can you shed some light?
public class MyDataSeries : XyDataSeries<double>
{
    public MyDataSeries()
    {

    }
}

public class MyRenderableSeries : CustomRenderableSeries
{
    public MyRenderableSeries()
    {

    }

    protected override void Draw(IRenderContext2D renderContext, IRenderPassData renderPassData)
    {
        base.Draw(renderContext, renderPassData);

        if (DataSeries is not MyDataSeries series)
            return;

        using (var brush = renderContext.CreateBrush(Brushes.Red))
        using (var pen = renderContext.CreatePen(Colors.Black, true, 1))
        {
            for (int i = 0; i < series.Count; ++i)
            {
                double pos = (double)series.XValues[i];

                var x = renderPassData.XCoordinateCalculator.GetCoordinate(pos);
                var y = renderPassData.YCoordinateCalculator.GetCoordinate(pos);
                var s = renderPassData.XCoordinateCalculator.GetCoordinate(0) - renderPassData.XCoordinateCalculator.GetCoordinate(1);

                var points = CreateCircle(new Point(x, y), s);
                renderContext.FillPolygon(brush, points);
            }
        }
    }

    private List<Point> CreateCircle(Point pos, double radius)
    {
        var points = new List<Point>();

        int count = 1000;
        for (int i = 0; i < count; ++i)
        {
            double angle = (360.0 / count * i) * (Math.PI / 180);
            double x = Math.Cos(angle) * radius;
            double y = Math.Sin(angle) * radius;

            points.Add(new Point(pos.X + x, pos.Y + y));
        }

        points.Add(points[0]);

        return points;
    }
}

public class MyRenderableSeriesViewModel : BaseRenderableSeriesViewModel
{
    public override Type ViewType => typeof(MyRenderableSeries);
}

public class MyViewModel : BaseViewModel
{
    public List<IRenderableSeriesViewModel> RenderableSeriesViewModels { get; }

    public MyViewModel()
    {
        RenderableSeriesViewModels = new List<IRenderableSeriesViewModel>
        {
            Generate(Enumerable.Range(0, 25).Select(x => (double)x).ToArray()),
        };
    }

    private IRenderableSeriesViewModel Generate(double[] data)
    {
        var dataSeries = new MyDataSeries();
        dataSeries.Append(data, data);

        return new MyRenderableSeriesViewModel
        {
            DataSeries = dataSeries,
            StyleKey = "mySeriesStyle"
        };
    }
}


<UserControl x:Class="SciChart.Examples.Examples.SeeFeaturedApplication.Histogram.ViolinView"
         xmlns="http://schemas.microsoft.com/winfx/2006/xaml/presentation"
         xmlns:s="http://schemas.abtsoftware.co.uk/scichart"
         xmlns:d="http://schemas.microsoft.com/expression/blend/2008"
         xmlns:x="http://schemas.microsoft.com/winfx/2006/xaml"
         xmlns:mc="http://schemas.openxmlformats.org/markup-compatibility/2006"
         xmlns:local="clr-namespace:SciChart.Examples.Examples.SeeFeaturedApplication.Histogram"
         mc:Ignorable="d">

<UserControl.Resources>
    <ResourceDictionary>
        <ResourceDictionary.MergedDictionaries>
            <ResourceDictionary Source="/SciChart.Charting;component/Themes/Default.xaml" />
        </ResourceDictionary.MergedDictionaries>

        <Style TargetType="{x:Type local:MyRenderableSeries}"
               BasedOn="{StaticResource MvvmDefaultRenderableSeriesStyle}"
               x:Key="mySeriesStyle">
        </Style>
    </ResourceDictionary>
</UserControl.Resources>

<s:SciChartSurface x:Name="SciChart"
                   RenderableSeries="{s:SeriesBinding RenderableSeriesViewModels}">
    <s:SciChartSurface.RenderSurface>
        <s:VisualXcceleratorRenderSurface />
    </s:SciChartSurface.RenderSurface>

    <s:SciChartSurface.XAxis>
        <s:NumericAxis />
    </s:SciChartSurface.XAxis>

    <s:SciChartSurface.YAxis>
        <s:NumericAxis />
    </s:SciChartSurface.YAxis>
    <s:SciChartSurface.ChartModifier>
        <s:ModifierGroup>
            <s:ZoomPanModifier />
            <s:RubberBandXyZoomModifier ExecuteOn="MouseRightButton" />
            <s:ZoomExtentsModifier ReceiveHandledEvents="False" />
            <s:MouseWheelZoomModifier />
        </s:ModifierGroup>
    </s:SciChartSurface.ChartModifier>
</s:SciChartSurface>
I have tested this on 3 machines, and all show the same behaviour.
**VisualXcceleratorEngine: Creating VisualXcceleratorRenderSurface Visual Xccelerator Engine v7.0.1.27055
GPU Capability Test ### Is BGRA feature required: TRUE
Examining Graphics Adapter: Intel(R) Iris(R) Xe Graphics VRAM:
128Mb DeviceId: 39497Visual Xccelerator Engine Direct3D9 Compatibility
Determines whether the adapter is blacklisted due to its unstable work… FALSE
Trying to create Direct3D9 Device… SUCCESSVisual Xccelerator Engine Direct3D11 Compatibility
Trying to create Direct3D9Ex Device (WPF Compatibility)… SUCCESS
Trying to create Direct3D11 Device… SUCCESSRank: 3000128 Points
Examining Graphics Adapter: NVIDIA T500 VRAM: 1928Mb DeviceId:
8123Visual Xccelerator Engine Direct3D9 Compatibility
Determines whether the adapter is blacklisted due to its unstable work… FALSE
Trying to create Direct3D9 Device… FAILEDVisual Xccelerator Engine Direct3D11 Compatibility
Trying to create Direct3D9Ex Device (WPF Compatibility)… FAILED
Trying to create Direct3D11 Device… SUCCESSRank: 3001928 Points
Examining Graphics Adapter: Microsoft Basic Render Driver VRAM: 0Mb
DeviceId: 140Visual Xccelerator Engine Direct3D9 Compatibility
Determines whether the adapter is blacklisted due to its unstable work… FALSE
Trying to create Direct3D9 Device… FAILEDVisual Xccelerator Engine Direct3D11 Compatibility
Trying to create Direct3D9Ex Device (WPF Compatibility)… FAILED
Trying to create Direct3D11 Device… SUCCESSRank: 2000000 Points
Selected Graphics Adapter, where DeviceId is: 8123 Is Direct3D9
Supported: FALSE Is Direct3D11 Supported: TRUE Is Blacklisted:
FALSEPlease find the log file here:
C:\dev\TestApps\SciChart_Violin\bin\Debug\net6.0-windows\GpuCapability.log**VisualXcceleratorEngine: SUCCESS! VisualXcceleratorRenderSurface: attempt to initialize the engine with parameters: Use Direct3D9 –
False
- Ben Green asked 8 months ago
- last active 7 months ago
Hi Scichart Team.
I am working on the MouseWheelZoomModifier (EActionType.Pan).
But my users are using a trackpad (apple magic trackpad).
Currently, they are using 2 fingers and move up or down (vertically) to pan the chart. But they are asked to pan the chart by using 2 fingers and move left or right (horizontally) instead.
Do we have any setting for MouseWheelZoomModifier that help me pan the chart by that way?
- TRUONG LE asked 8 months ago
- last active 8 months ago
By following this example to create reusable SciChart component in React:
https://www.scichart.com/documentation/js/current/TutorialReusableReactComponent.html
The chart cannot be created when run in dev mode. But it works well under production mode. I think it’s because React renders components twice in strict mode. It seems that SciChart got problems to create chart with the following logic when running the application in dev mode. Is this true? Or I missed anything?
 useEffect(() => {
    const chartInitializationPromise = props.initChart(rootElementId).then((initResult) => {
        sciChartSurfaceRef.current = initResult.sciChartSurface;
        return initResult.sciChartSurface;
    });
    const performCleanup = () => {
        sciChartSurfaceRef.current.delete();
        sciChartSurfaceRef.current = undefined;
    };

    return () => {
        // check if chart is already initialized or wait init to finish before deleting it
        sciChartSurfaceRef.current ? performCleanup() : chartInitializationPromise.then(performCleanup);
    };
}, []);
- Quyen Sy asked 8 months ago
- last active 3 months ago
I have a chart with stacked xAxes, and I am trying to calculate the stackedLength of each xAxis base on the total length or width available for the xAxes.
The issue come when I am changing the size of the screen or changing the width of the chart using flex-basis. When I do that, I get the error message in the picture below.
My question is, is there a way for me to listen/subscribe to the width change or get the latest width?
- Nung Khual asked 8 months ago
- last active 8 months ago
Greetings,
i have three Series in a SciChart.js (Community-Version) Surface.
The Legend i added shows me all three of them and their names and checkboxes do hide or show the series.
Here is my problem: Is there a way to hide one Series (a FastCandlestickRenderableSeries) from the Legend? I only want to show the other two Series (FastLinerenderableSeries).
Somethin like a Parameter “showInLegend: false,”? I did not find something like this in the documentation(https://www.scichart.com/documentation/js/current/typedoc/classes/legendmodifier.html).
Thank you
- Sebastian Affeld asked 8 months ago
- last active 8 months ago
I am considering applying server-side licensing for my javerScript application.
In the document below, there is a phrase “Our server-side licensing component is written in C++.”
(https://support.scichart.com/support/solutions/articles/101000515345-scichart-js-domain-licensing-faq)
However, there is only asp.net sample code on the provided github.
(https://github.com/ABTSoftware/SciChart.JS.Examples/tree/master/Sandbox/demo-dotnet-server-licensing)
I wonder if there is a sample code implemented in C++ for server-side licensing.
Can you provide c++ sample code?
Also, are there any examples to run on Ubuntu?
- Donghwan Kim asked 8 months ago
- last active 1 month ago
I am working on a multithreaded application where the acquisition and chart display run on different threads. I am attempting to collect samples and plot only when I have 100 samples available to have less resource consumption and keep the application responsive. However, when I change the number of samples in the block, my FIFO capacity seems to change, allowing significantly less amount of samples than the ones I need. The current FIFO capacity should allow for at least 16 mins worth of data, but it only shows less than a second
If I set the block size to 1 (single sample appending) I obtain the results I need, but I am seeing performance issues in other areas of the program, hence the need of appending in blocks.
See the attachments for more clarity. Any suggestions?
EDIT: Adding code
private void DisplayNPD()
        {
            XyDataSeries<float, float> npdRawDataSeries = new XyDataSeries<float, float>();
            int fifoSize = 1000000;
            npdRawDataSeries.FifoCapacity = fifoSize;
            npdRawData_RS.DataSeries = npdRawDataSeries;

            double npdRaw = 0;
            bool successfulDequeue = false;
            int samplesQueued = 0;
            int samplesInBlock = 100;
            float[] rawSamples = new float[samplesInBlock];
            float[] time = new float[samplesInBlock];

            while (!ImagingSession.terminateThreads)
            {
                if (ImagingSession.laserOnOff && !graphRestarted)
                {
                    int npdElementsInQueue = npdDisplayQueue.Count;
                    if (npdElementsInQueue > 0)
                        successfulDequeue = npdDisplayQueue.TryDequeue(out npdRaw);

                    if (successfulDequeue)
                    {
                        currentTime = graphStopwatch.ElapsedMilliseconds * 0.001;
                        time[samplesQueued] = (float) currentTime;
                        rawSamples[samplesQueued] = (float) (npdRaw * 1000);

                        samplesQueued++;
                        if (samplesQueued == samplesInBlock)
                        {
                            using (npdRawDataSeries.SuspendUpdates())
                                npdRawDataSeries.Append(time, rawSamples);
                            samplesQueued = 0;

                            if (currentTime > upperLimit)
                            {
                                lowerLimit = upperLimit;
                                upperLimit += xAxisWidth;
                                AdjustXAxis(currentHorizontalScale);
                            }
                        }
                    }
                }
            }
        }
- Matthew Beatty asked 9 months ago
- last active 8 months ago
Hello,
I want to render a base64 image in ScichartJS without actually rendering it in DOM. I saw that you have these guides in WPF:
https://support.scichart.com/index.php?/Knowledgebase/Article/View/17213/34/
https://www.scichart.com/documentation/win/current/webframe.html#Screenshots,_Printing_and_Export_to_XPS.html
However it is difficult to achieve it in Typescript. Is there a guide or any ideas on how to do it? I would appreciate any answer.
- Zino As asked 9 months ago
- last active 9 months ago
Hello, I am using SciChartJS and have a new requirement from our users as follows that I need help with the implementation. Any pointers from anyone would be a great help.
**Requirements: **
- Assume that x-axis is Time and y-axis is prices.
- There are multiple series in the chart (e.g., Bid Price, Ask Price)
- Allow user to select a time on xAxis using
CTRL + CLICK - When the user selects the time, show the rollover line and the tooltip for all series at the selected time
- This rollover line and tooltip should remain visible until the user selects a new time on the x-axis at which point the rollover tooltip should display the tooltip for the new point.
I started inheriting the RolloverModifier but couldn’t find an appropriate method to show the tooltip.
So, I started implementing the above feature using CustomModifierBase2d and adding a VerticalLineAnnotation for the rollover line. But again, struggling with the tooltip.
If someone could help me out or give me pointers, that would be highly appreciated.
Best Regards,
Sachin Patel.
- sachin patel asked 9 months ago
- last active 8 months ago
I want to create two xAxis, the first one will be a normal xAxis and the second one will be an array of date ranges, but the issue then is that since all the xAxis are inside one array together, they all are stacked on top of each other.
I tried sciChartSurface.layoutManager.bottomOuterAxesLayoutStrategy = new BottomAlignedOuterHorizontallyStackedAxisLayoutStrategy(); but that only create all xAxis into one line of xAxis.
I want two line of xAxis, where the first one is normal, but second xAxis should be Horizontally Stacked Axis Layout.
The first image is before horizontal stacked is applied and the second after.
The third image show the xAxes array from sciChartSurface.xAxes, the index(0) of the array is the first xAxis, which should be normal, and the rest (index 1 – 8) should be horizontally stacked.
The horizontal stacked xAxis should be right below the first xAxis.
- Nung Khual asked 9 months ago
- last active 9 months ago
I used an IPointMarkerPaletteProvider to change the color of the bubble chart to a solid color. However, the circles are not smooth around the perimeter, and they look very stepped. The same thing happens when I set the AntiAliasing property of the FastBubbleRenderableSeries to True. How can I make it a smooth circle?
- sungchul park asked 9 months ago
- last active 8 months ago
I want the bubbles in my bubble chart to be one color with no gradient, and I also want to color the border line. How can I do this?
- sungchul park asked 9 months ago
- last active 9 months ago
Hi,
All MyGet systems which host the SciChart nuget feeds are down: https://status.myget.org/
Does someone know where to report this issue and how to get any more information on this downtime? E.g. is it planned and is there an estimate how long this is going to take?
Thanks!
- Christian Liebhardt asked 9 months ago
- last active 9 months ago
My application is written in .net 7 wpf using scichart will the application work on linux with scichart?
- Бектемир v asked 9 months ago
- last active 9 months ago
Hi there,
I am experiencing a problem with a license key error when I deployed the project to the staging environment.
Here are the steps I followed:
- I registered the domain and test domain on scichart.com/profile.
- I generated a runtime key.
- I included that key in the code base and then deployed it.
I have attached a screenshot below that shows the errors.
- Umer Nawaz asked 9 months ago
- last active 8 months ago
It seems to me that DateTimeNumericAxis has edge cases where it can’t calculate deltas for some ranges.
This results in a console error, and the chart not loading:
Error from chart in div date-axis-bug RangeError: Maximum call stack size exceeded
at get minTicks [as minTicks] (index.min.js:1:577149)
at a (index.min.js:1:577393)
at a (index.min.js:1:577567)
at a (index.min.js:1:577483)
at a (index.min.js:1:577567)
at a (index.min.js:1:577483)
at a (index.min.js:1:577567)
at a (index.min.js:1:577483)
at a (index.min.js:1:577567)
at a (index.min.js:1:577483)
Provided codepen: https://codepen.io/jrfv/pen/xxQawom
Any suggestions?
Thanks!
- João Velasques asked 9 months ago
- last active 9 months ago
Is it possible to draw a graph without passing values to other charts just by doing RenderableSeries.Add?
in WPF C#
- SEONG JEONGWOO asked 9 months ago
- last active 9 months ago
Hi, I’m looking for a way to programmatically dismiss a RolloverModifier from a chart. I’ve been tasked with creating a user experience that does two things: 1. when a user stops scrubbing on the chart, the rollover modifier should persist, and 2. when the user taps outside of the chart the rollover modifier should disappear.
I’ve accomplished the first part of the problem by implementing a subclass of SCIRolloverModifier and overriding the onEvent(args:) function, but I cannot figure out how to dismiss the rollover modifier when the user taps outside the chart surface.
Is there a way to accomplish this?
- Tyler Williamson asked 9 months ago
- last active 9 months ago
I have a big problem with memory, i try many things but it’s doesn’t effect.
It’s my code for testing memory :
    const { wasmContext, sciChartSurface } = await SciChartSurface.create("bandTest", { theme: new SciChartJSLightTheme() });
    sciChartSurface.title = "Axis 1";
    sciChartSurface.xAxes.add(new NumericAxis(wasmContext, { axisTitle: "Column number", axisTitleStyle: {fontSize: 12} }));
    sciChartSurface.yAxes.add(new NumericAxis(wasmContext, { axisAlignment: EAxisAlignment.Left, axisTitleStyle: {fontSize: 12} }));
    setTimeout(sciChartSurface.delete(),2000);
sciChartSurface.delete() have no effect for memory
I run snapshot without this code and another snapshot with this code. (snap 14 is before call SciChart and snap 15 is after call the code bellow)
What can I do?
Regards
- Marjorie lesage asked 9 months ago
- last active 8 months ago
I have a use case for a chart, that is a heatmap, which may also contain multiple series drawn on top, with multiple internal axis as well.
I can’t transform the data I receive, because that would be too slow, and it needs to maintain a speedy feeling, even when appending more data.
For this reason, when building the chart, I just flip the axis. The bottom axis is the Y axis, and the left axis it the X axis.
The multiple series that can be added (XyDataSeries), provide one extra axis each, and use one of the main axis.
We can think of them as horizontal or vertical series, depending if they use the main X axis, or the main Y axis.
When hovering over the chart, I want to show a tooltip, that shows for each series, their own axis value.
The issue — The normal CursorModifier, can’t correctly present a tooltip, for this case of mixed horizontal/vertical series. I’m not sure if there are configurations I’m missing, or if it is an actual uncovered edge case, hoping to get an answer on this.
To show what the issue is, and how I’m currently fixing it, please have a look at the codepen I made -> https://codepen.io/jrfv/full/zYMjEzP
Any tips on this, is it something scichart will fix eventually?
- João Velasques asked 9 months ago
- last active 7 months ago
How can i modify candlestick item so it will have rounded corners? Like in linked image
- daniil Pak asked 9 months ago
- last active 9 months ago
Greetings! I see you have support Xamarin.iOS and Xamarin.Android, however, I’m not sure about support status: do you support .NET 7 iOS and Android?
- Chihirov Chihirov asked 9 months ago
- last active 9 months ago
Hello,
tell me please, how can I add such indicators on yAxis. Maybe you have some example on sandbox for JS.
Thank you!
- Yevhenii Krasovskyi asked 9 months ago
- last active 8 months ago
Hello, help me please.
I have situations when all panels with different graphs are updated and after that all graphs are not displayed. The containers are not equivalent to the previous ones and I need to set up new divs. How can i do this?
- Yevhenii Krasovskyi asked 9 months ago
- last active 8 months ago
I created a simple .NET6 WPF application and added the SciChart assembly references. I call SciChartSurface.SetRuntimeLicenseKey(…) in App constructor and run the application. I get the following exception:
*System.TypeInitializationException: The type initializer for ‘njm’ threw an exception. Source=SciChart.Core
Inner Exception 1:
InvalidOperationException: babel m0 7238858: Method not found: ‘System.Reflection.Emit.AssemblyBuilder System.AppDomain.DefineDynamicAssembly(System.Reflection.AssemblyName, System.Reflection.Emit.AssemblyBuilderAccess)’.
Inner Exception 2:
MissingMethodException: Method not found: ‘System.Reflection.Emit.AssemblyBuilder System.AppDomain.DefineDynamicAssembly(System.Reflection.AssemblyName, System.Reflection.Emit.AssemblyBuilderAccess)’.*
Everything works well if I use SciChart in a .NET4.8 WPF application. How can I fix this? Thanks.
- Marius Cabas asked 9 months ago
- last active 9 months ago
Hello, i want to customize tooltip in graph (SplineBandRenderableSeries), i can change the tooltip content but if i return svg like your example ( return <svg width="${width}" height="${height}">))
<circle cx="50%" cy="50%" r="50%" fill="${tooltipColor}"/>
<svg width="100%">
<text y="40" font-size="13" font-family="Verdana" dy="0" fill="${tooltipTextColor}">
<tspan x="15" dy="1.2em">${tooltipTitle}</tspan>
<tspan x="15" dy="1.2em">x: ${seriesInfo.formattedXValue} y: ${seriesInfo.formattedYValue}</tspan>
</text>
</svg>
</svg>
It doesn’t work. I have this error in console: Error from chart in div band0 TypeError: valuesWithLabels.reduce is not a function
and
Error from chart in div band0 DOMException: Failed to execute ‘removeChild’ on ‘Node’: The node to be removed is not a child of this node.
at RolloverTooltipSvgAnnotation.delete …
My graph has 3 renderableSeries (1 XyDataSeries and 2 XyyDataSeries)
Please can you send me an example in (javascript) for modify tooltip styling ?
Thanks.
- Marjorie lesage asked 9 months ago
- last active 8 months ago
We’re working on a Nyquist plot using the latest SciChart SDK for WPF.
We have quite a MVVM dependent structure already in place.
We are working with 3D frequency based Complex data. The Nyquist plot would have 2 axes – Y for Imaginary values and X axis for Real values. We apply some averaging and post-processing of the 3D data to put in 2D form and show it in the Nyquist plot.
However, we’d like to be able to scroll the data at certain frequency ranges without showing the actual frequency graph in the plot. Is there a possibility to implement an independent scrollbar containing a averaged magnitude graph (similar idea to the processing of the Nyquist data) over a frequency range? We’d like to scroll this frequency range and on selected range changed to recalculate data in the Nyquist plot.
We have quite an extensive graphing structure implemented already. The main issue I’m currently facing is that the scrollbar is bound to the SciChartSurface and I cannot seem to figure out how to build it more like a “sexy” frequency range selector while staying within the SciChart library? Is there any possibility to not be bound to the SciChartSurface? And of course, the axes are quite different – in the Nyquist we have linear real and imaginary values (-2 to +2, for example) whereas the frequency range would extend much further data-wise (0 – 3000 Hz, for example).
Any help would be appreciated. Feel free to ask for more details.
- Kaloyan Krastev asked 9 months ago
- last active 2 months ago
Hello,
Python with Matplotlib allows us to draw a line series that has multiple color depending on something else as shown below (https://matplotlib.org/3.3.0/gallery/lines_bars_and_markers/multicolored_line.html):
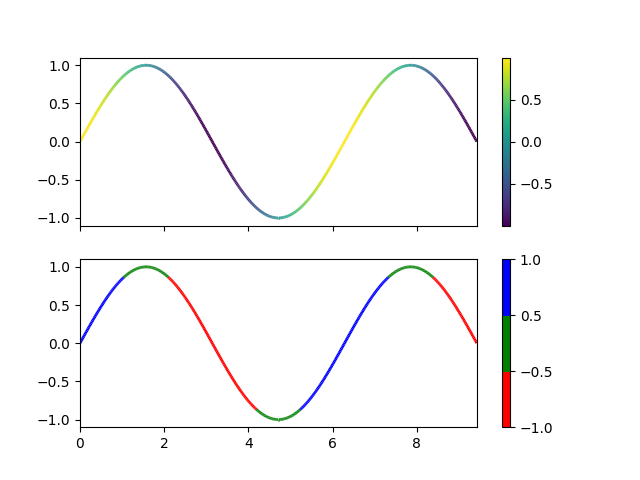
Is it possible with SciChart (WPF version)?
- Tetsu Shimizu asked 9 months ago
- last active 9 months ago
Is there any way to write data labels in Android? I know it exists in JavaScript, but I can’t find a way to do it in Android.
- yeana jun asked 10 months ago
- last active 10 months ago
Hello.
In my project, I am trying to display four SciChartSurfaces with a single legend. Furthermore, I want the Visibility changes of each series in the legend checkbox to be reflected in all SciChartSurfaces.
The following code achieves this, but I am not confident that it is the best solution. Is there a more Smart way to accomplish this?
MainWindow.xaml
<Window x:Class="SurveyFleetVisionChartLegend.MainWindow"
    xmlns="http://schemas.microsoft.com/winfx/2006/xaml/presentation"
    xmlns:x="http://schemas.microsoft.com/winfx/2006/xaml"
    xmlns:d="http://schemas.microsoft.com/expression/blend/2008"
    xmlns:local="clr-namespace:SurveyFleetVisionChartLegend"
    xmlns:mc="http://schemas.openxmlformats.org/markup-compatibility/2006"
    xmlns:s="http://schemas.abtsoftware.co.uk/scichart"
    Title="MainWindow"
    Width="800"
    Height="550"
    d:DataContext="{d:DesignInstance {x:Type local:MainWindowViewModel}}"
    mc:Ignorable="d">

<Window.DataContext>
    <local:MainWindowViewModel />
</Window.DataContext>
<Window.Resources>
    <BooleanToVisibilityConverter x:Key="BooleanToVisibilityConverter" />
</Window.Resources>
<Grid>
    <Grid.RowDefinitions>
        <RowDefinition />
        <RowDefinition />
        <RowDefinition />
        <RowDefinition />
        <RowDefinition Height="auto" />
    </Grid.RowDefinitions>

    <s:SciChartSurface Grid.Row="0"
                       Margin="5"
                       VerticalAlignment="Stretch"
                       Background="WhiteSmoke"
                       CacheMode="{x:Null}"
                       ChartTitle="SciChartSurface1"
                       RenderableSeries="{s:SeriesBinding GraphSeriess1.Value,
                                                          Mode=OneWay,
                                                          UpdateSourceTrigger=PropertyChanged}">

        <s:SciChartSurface.XAxis>
            <s:NumericAxis DrawLabels="False"
                           GrowBy="0.1, 0.1" />
        </s:SciChartSurface.XAxis>

        <s:SciChartSurface.YAxis>
            <s:NumericAxis HorizontalContentAlignment="Left"
                           DrawLabels="False"
                           GrowBy="0.1, 0.1" />
        </s:SciChartSurface.YAxis>
        <s:SciChartSurface.ChartModifier>
            <s:ModifierGroup>
                <s:LegendModifier x:Name="TrendChartLegendModifier"
                                  ShowLegend="False"
                                  Visibility="Visible" />
            </s:ModifierGroup>
        </s:SciChartSurface.ChartModifier>
    </s:SciChartSurface>
    <s:SciChartSurface Grid.Row="1"
                       Margin="5"
                       VerticalAlignment="Stretch"
                       Background="WhiteSmoke"
                       ChartTitle="SciChartSurface2"
                       RenderableSeries="{s:SeriesBinding GraphSeriess2.Value,
                                                          UpdateSourceTrigger=PropertyChanged}">

        <s:SciChartSurface.XAxis>
            <s:NumericAxis DrawLabels="False"
                           GrowBy="0.1, 0.1" />
        </s:SciChartSurface.XAxis>

        <s:SciChartSurface.YAxis>
            <s:NumericAxis HorizontalContentAlignment="Left"
                           DrawLabels="False"
                           GrowBy="0.1, 0.1" />
        </s:SciChartSurface.YAxis>
    </s:SciChartSurface>
    <s:SciChartSurface Grid.Row="2"
                       Margin="5"
                       VerticalAlignment="Stretch"
                       Background="WhiteSmoke"
                       ChartTitle="SciChartSurface3"
                       RenderableSeries="{s:SeriesBinding GraphSeriess3.Value}">

        <s:SciChartSurface.XAxis>
            <s:NumericAxis DrawLabels="False"
                           GrowBy="0.1, 0.1" />
        </s:SciChartSurface.XAxis>

        <s:SciChartSurface.YAxis>
            <s:NumericAxis HorizontalContentAlignment="Left"
                           DrawLabels="False"
                           GrowBy="0.1, 0.1" />
        </s:SciChartSurface.YAxis>
    </s:SciChartSurface>
    <s:SciChartSurface Grid.Row="3"
                       Margin="5"
                       VerticalAlignment="Stretch"
                       Background="WhiteSmoke"
                       ChartTitle="SciChartSurface4"
                       RenderableSeries="{s:SeriesBinding GraphSeriess4.Value}">

        <s:SciChartSurface.XAxis>
            <s:NumericAxis DrawLabels="False"
                           GrowBy="0.1, 0.1"
                           VisibleRangeLimitMode="MinMax" />
        </s:SciChartSurface.XAxis>

        <s:SciChartSurface.YAxis>
            <s:NumericAxis HorizontalContentAlignment="Left"
                           DrawLabels="False"
                           GrowBy="0.1, 0.1" />
        </s:SciChartSurface.YAxis>
    </s:SciChartSurface>

        <!--  Display the legend for Chart1.  -->
        <!--  Synchronization of Visiblity of each series of each SciChartSurface is performed on the ViwModel side.  -->
        <s:SciChartLegend Grid.Row="4"
                          Grid.Column="1"
                          HorizontalAlignment="Stretch"
                          HorizontalContentAlignment="Center"
                          LegendData="{Binding LegendData,
                                               ElementName=TrendChartLegendModifier}"
                          Orientation="Vertical"
                          ScrollViewer.VerticalScrollBarVisibility="Auto"
                          ShowVisibilityCheckboxes="True" />
    </Grid>
</Window>
MainWindowViewModel.cs
    using Reactive.Bindings;
using Reactive.Bindings.Extensions;
using SciChart.Charting.Common.Extensions;
using SciChart.Charting.Model.ChartData;
using SciChart.Charting.Model.ChartSeries;
using SciChart.Charting.Model.DataSeries;
using System;
using System.Collections.Generic;
using System.Collections.ObjectModel;
using System.Linq;
using System.Reactive.Disposables;
using System.Reactive.Linq;
using System.Text;
using System.Threading.Tasks;
using System.Windows;
using System.Windows.Documents;
using System.Windows.Media;
using System.Xml.Linq;

namespace SurveyFleetVisionChartLegend
{
    public class MainWindowViewModel
    {
        public ReactivePropertySlim<List<IRenderableSeriesViewModel>> GraphSeriess1 { get; set; } = new ReactivePropertySlim<List<IRenderableSeriesViewModel>>();
        public ReactivePropertySlim<List<IRenderableSeriesViewModel>> GraphSeriess2 { get; set; } = new ReactivePropertySlim<List<IRenderableSeriesViewModel>>();
        public ReactivePropertySlim<List<IRenderableSeriesViewModel>> GraphSeriess3 { get; set; } = new ReactivePropertySlim<List<IRenderableSeriesViewModel>>();
        public ReactivePropertySlim<List<IRenderableSeriesViewModel>> GraphSeriess4 { get; set; } = new ReactivePropertySlim<List<IRenderableSeriesViewModel>>();

        public ReactiveCommand RecreateCommand { get; set; }

        private List<string> chartNames;
        private Dictionary<string, bool> seriesVisibles { get; set; }
        private Random random = new Random();

        public MainWindowViewModel()
        {
            chartNames = new List<string>() { "Chart1", "Chart2", "Chart3" };
            seriesVisibles = new Dictionary<string, bool>();
            chartNames.ForEach(a => seriesVisibles.Add(a, true));

            GraphSeriess1.Value = createGraphSeriess("Chart");
            GraphSeriess2.Value = createGraphSeriess("Chart");
            GraphSeriess3.Value = createGraphSeriess("Chart");
            GraphSeriess4.Value = createGraphSeriess("Chart");

            // If the legend changes the Visibility of each series in GraphSeriess1,
            // Vary the Visibility of each series in other GraphSeriess.
            GraphSeriess1.Subscribe(s=> {
                if(s != null)
                    s.ForEach(a =>
                    {
                        a.ObserveProperty(b => b.IsVisible).Subscribe(_ =>
                        {
                            if (GraphSeriess2.Value != null)
                                GraphSeriess2.Value.First(c => c.DataSeries.SeriesName == a.DataSeries.SeriesName).IsVisible = a.IsVisible;
                            if (GraphSeriess3.Value != null)
                                GraphSeriess3.Value.First(c => c.DataSeries.SeriesName == a.DataSeries.SeriesName).IsVisible = a.IsVisible;
                            if (GraphSeriess4.Value != null)
                                GraphSeriess4.Value.First(c => c.DataSeries.SeriesName == a.DataSeries.SeriesName).IsVisible = a.IsVisible;
                            seriesVisibles[a.DataSeries.SeriesName] = a.IsVisible;
                        });
                    });
            });
        }

        private List<IRenderableSeriesViewModel> createGraphSeriess(string name)
        {
            return chartNames.Select((x,a) => createGraphSeries(x, a)).ToList();
        }

        private IRenderableSeriesViewModel createGraphSeries(string name, int index)
        {
            var dataSeries = new XyDataSeries<double>() { SeriesName = name};

            for (var i = 0; i < 5; i++)
            {
                dataSeries.Append(i, random.Next(100));
            }

            return new LineRenderableSeriesViewModel()
            {
                DataSeries = dataSeries,
                IsVisible = seriesVisibles[dataSeries.SeriesName],
                Stroke = Color.FromRgb((byte)(index * 200), (byte)(index * 100), (byte)(index * 100))
            };
        }
    }
}
That is all. Best regards.
- Kouki Takeda asked 10 months ago
- last active 10 months ago
