SciChart WPF v8.2 Released!
We’ve moved over to a new format for communicating our releases and updates of our popular WPF Chart control, by […]
Updated! March 21st 2019 with achievements so far… See Strikethrough sections below
This year we have a lot of exciting releases planned. We have been working very hard behind the scenes on research & development to improve our existing set of products, plus create new products. This work is often hidden from view but we want to give you an insight into what we are working on and when we hope to release!
We last published a roadmap two years ago and discussed how its our intention to become market leaders in cross-platform, high performance real-time charting. That was an ambitious plan for a small, privately owned company like ours without any external funding or debt! However, we are well on our way to achieving it. Here is a run-down of what we’ve achieved since the last roadmap update.
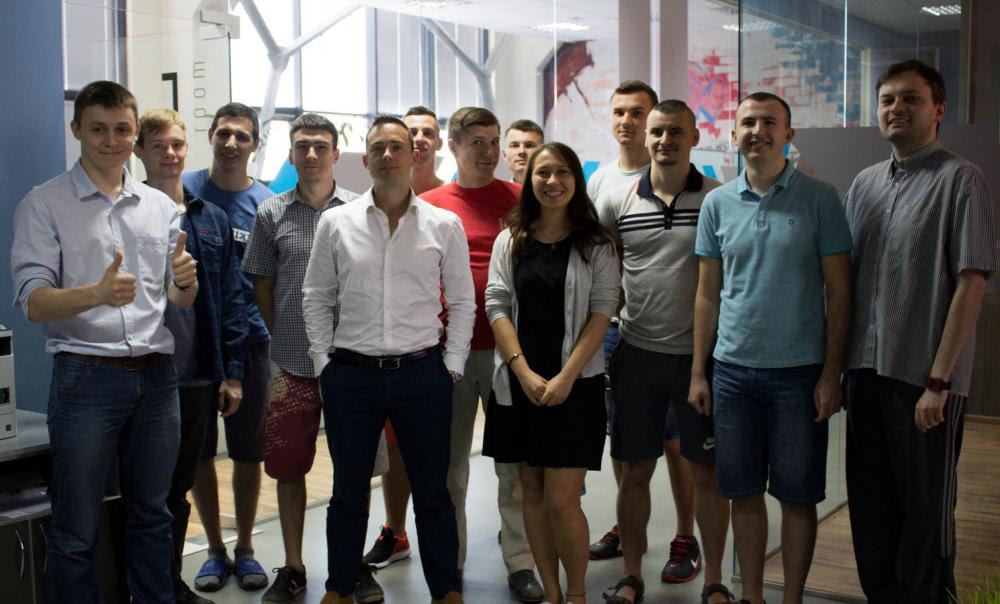
We were just getting started really, during this time we went from zero (just a guy with a laptop) to a team of about 7, releasing versions 1, 2 and 3 of our WPF charts.
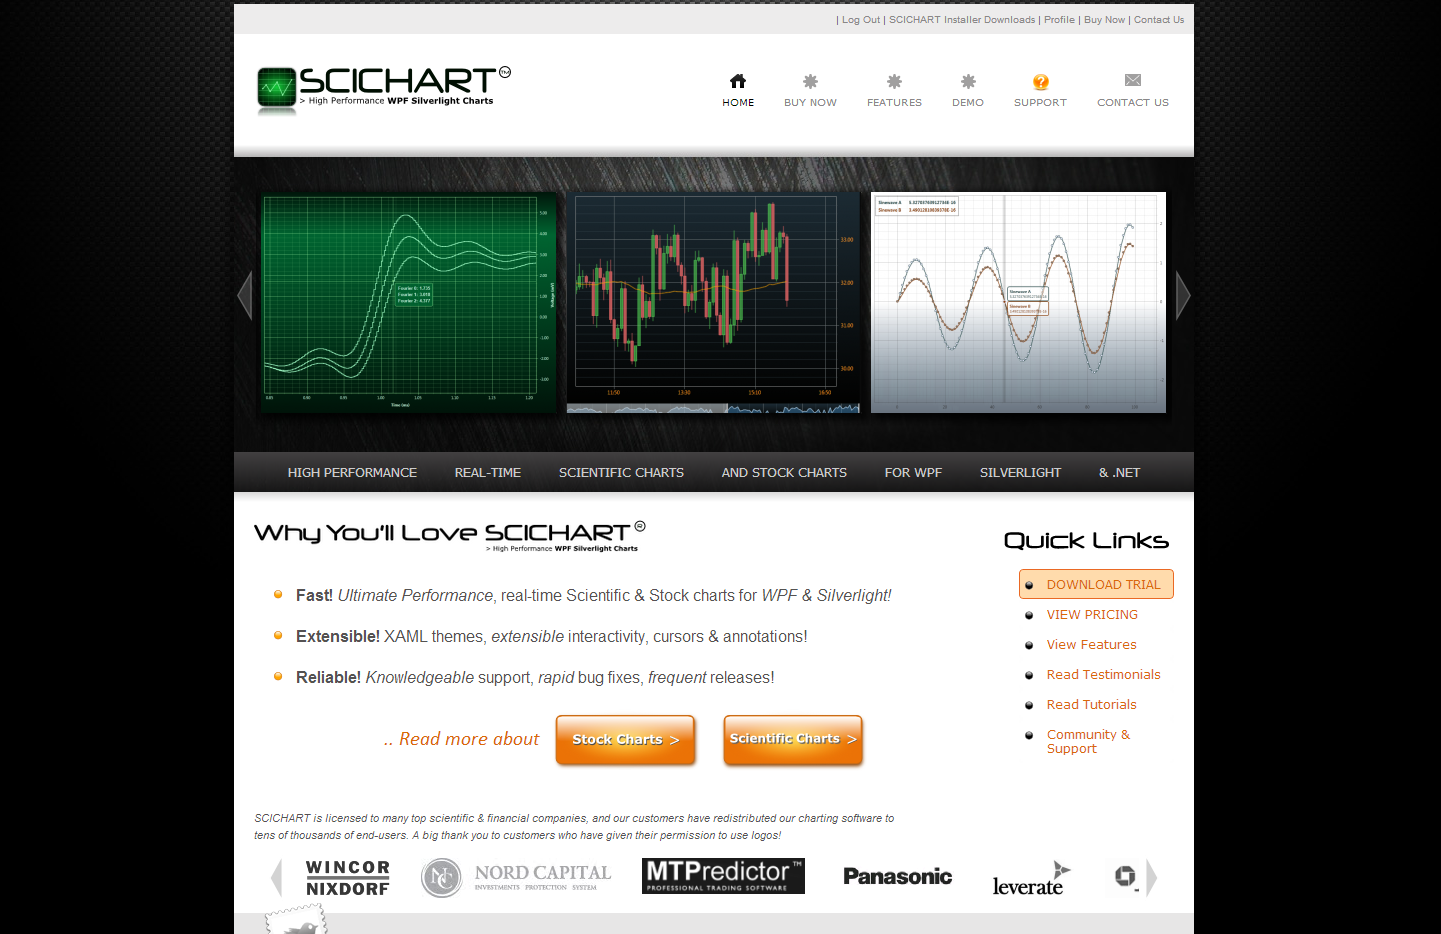
It’s funny to look back at those days and realise how bad our graphic design was!
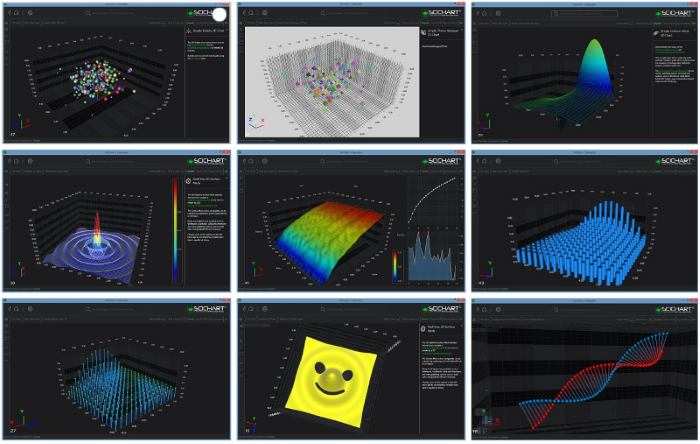
We released SciChart v4 which included WPF 3D Charts. The 3D Charts have been extremely successful and are used by companies all over the world to carry out complex, hardware-accelerated visualization of data in 3D. This work also pushed us into the position of Market Leader for High Performance WPF Charts, pushing us past our main competitors in volume (number of licenses sold).

We released a first version of our iOS/Android charts. SciChart for iOS/Android was performance tested vs. various competitors and easily became the worlds fastest iOS & Android Chart component (ios performance tests, android performance tests). Pretty soon after we had a success with one of our customers using SciChart Android on an embedded system to create a medical testing device.
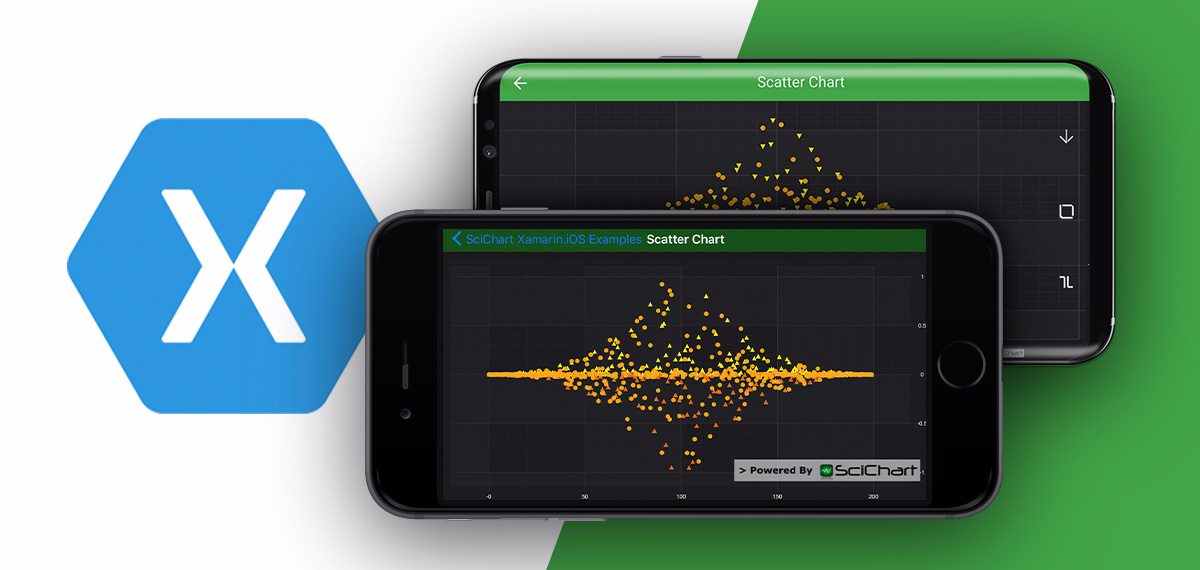
We released version 2 of our iOS/Android Charts. More chart types, a better API and more examples. Xamarin support was added. The demo applications were added to the app store and play store.
In 2017 we also completed a redesign of our website including Why-SciChart pages, Case-Studies and a reviews campaign, netting us a whopping 242 reviews with 98% positive to date!
Several releases of SciChart WPF v5.x, which added contours in 2D & 3D, filters API, DiscontinuousDateTimeAxis, Market Profile series, Radar Chart, Extreme Resamplers & performance improvements, Free surface mesh, 3D Polar chart, 3D Ellipsoid chart, 3D Cylindroid chart, and Financial trade annotation drawing tools.
You can see a list of the release notes here:
In addition, we released hundreds of bug fixes & minor updates via our Nightly Build / NuGet feed, and have also been working very hard to move more of our chart code to C++ (the original cross-platform language) to allow us to complete our vision. These sort of things you don’t see but are a huge piece of work required to make the next steps possible.
The coming year looks set to be packed with releases which will include the following.
We just silently released a documentation update for all our three platforms. Find information more easily with improved google search results as well as a cleaner, easier to read theme. Also the Forums now have an auto-search function which has already helped reduce the number of duplicate questions!
Thank you for your continued support of SciChart. We wouldn’t be where we are today, without you, the customer. To say thank you, we have a feature-packed year planned for you!
Remember that if you are a customer of SciChart, you will receive all major & minor releases that fall within your support subscription plan. It makes good sense to keep up to date and to renew SciChart WPF, iOS or Android so that you get the latest releases.
If you haven’t yet purchased but are thinking about doing so, take a look at the above, we have come a really long way in a short period of time and we believe the best is yet to come!
As always, we welcome your feedback and comments. If you have something to say, good or bad, please contact-us, as it can help shape the business.
Best regards,
Andrew
Related Posts
![]()
Queens Award for Innovation
Proud winners of the Queens Award for Innovation, 2019. Awarded on account of our innovative graphics engine which underpins the SciChart library and enables our world-beating charting performance
![]()
National Business Awards
Highly Commended for Lloyds National Business Awards, 2019. Awarded on account of our innovative graphics engine and impressive customer base

Reviews
SciChart has received hundreds of verified, 3rd party reviews
Start a trial and discover why we are the choice
of demanding developers worldwide