
SciChart WPF v8.3 Released!
We’ve moved over to a new format for communicating our releases and updates of our popular WPF Charts library, by publishing […]
After what feels like a long wait, our team has finished wrapping up SciChart WPF v5.0.0 Build 10958 which is released today! Read on to find out what’s new in this exciting version of the SciChart Charting Library.
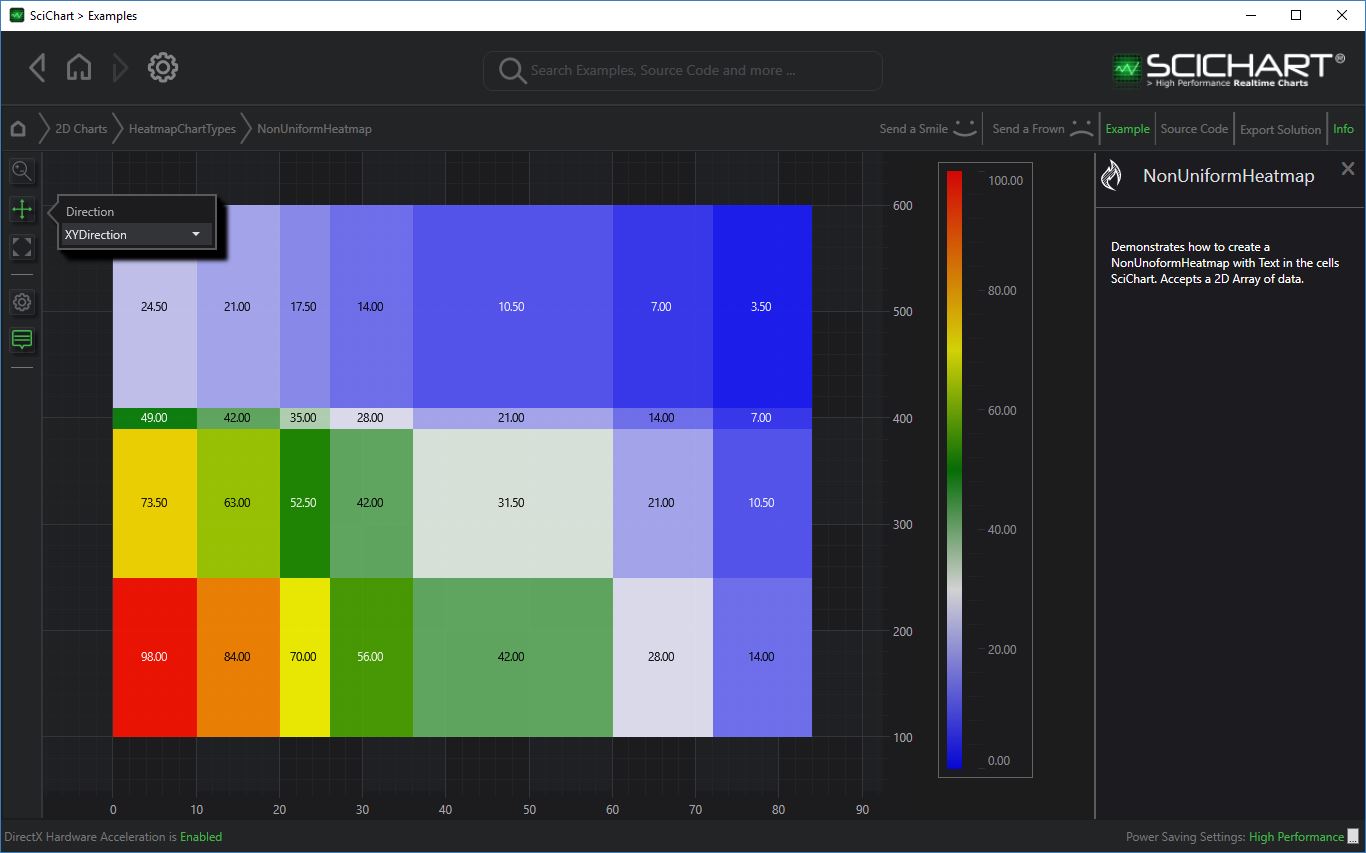
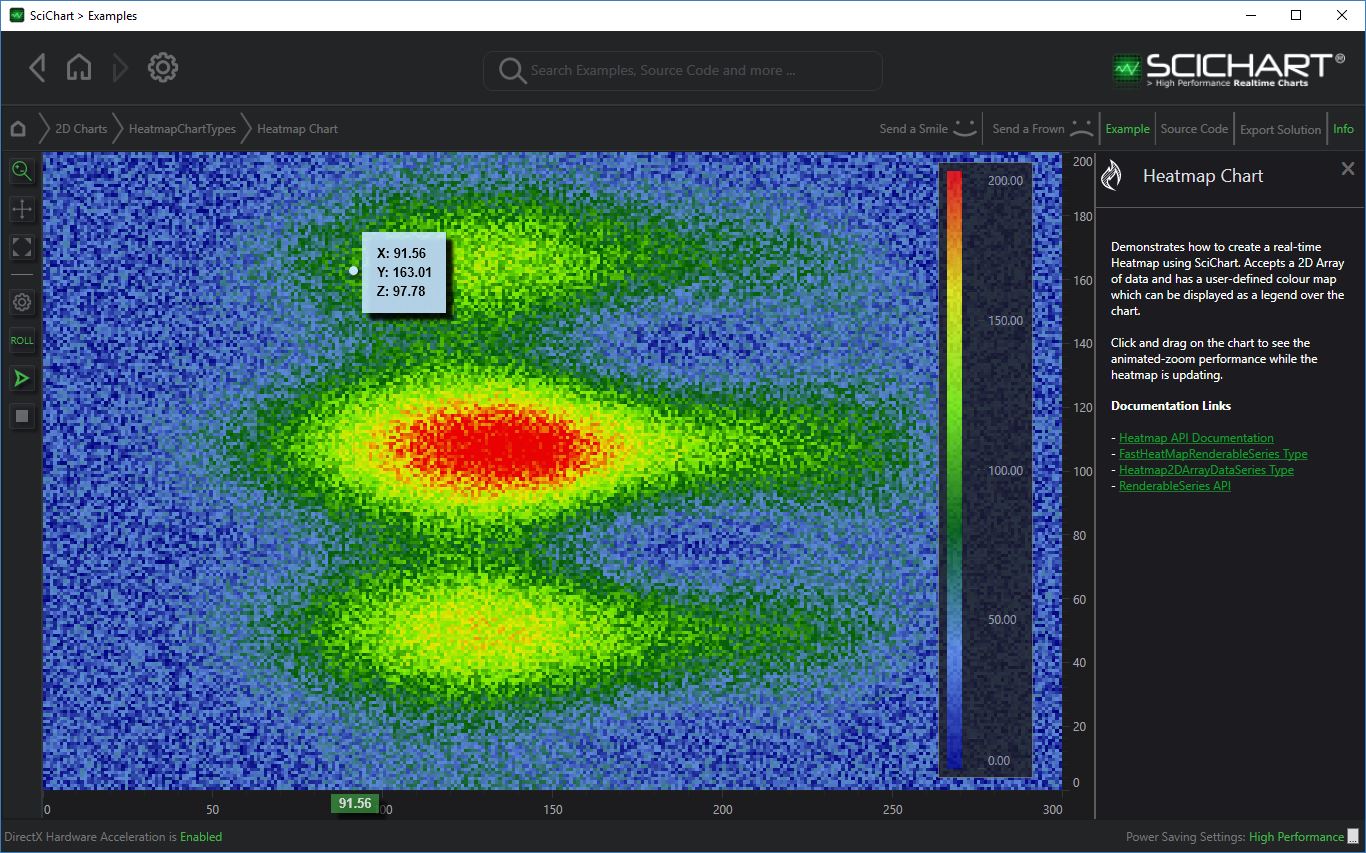
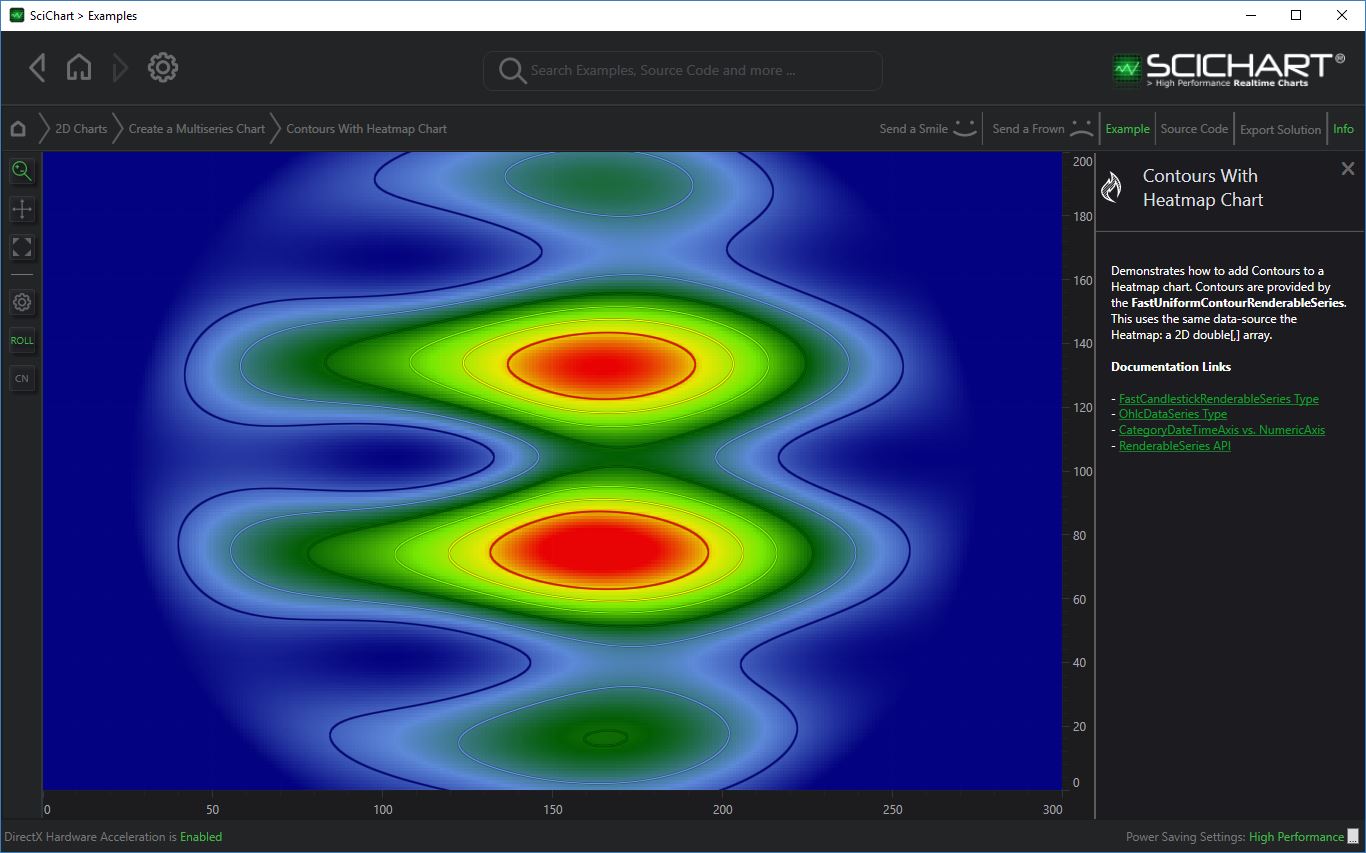
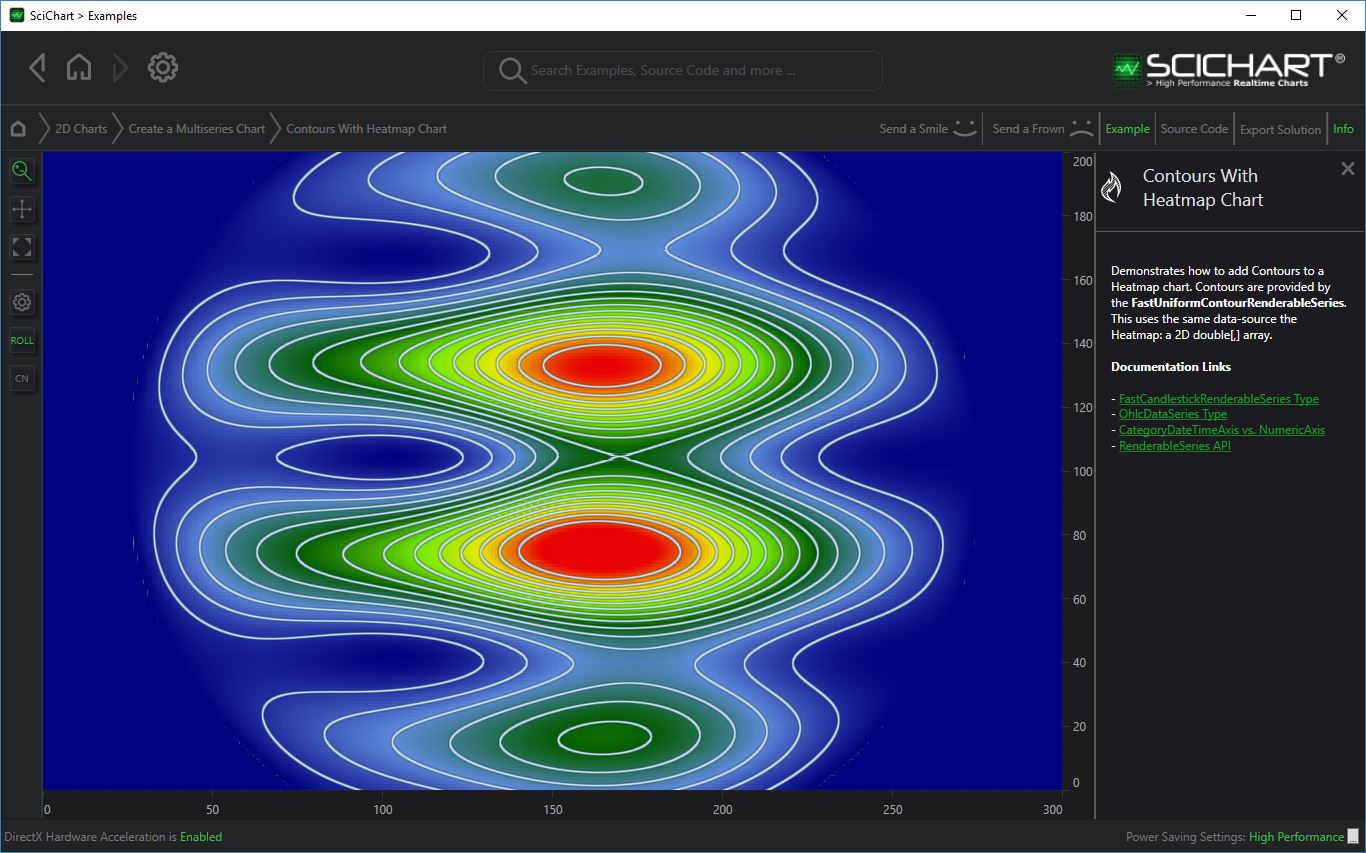
The FastHeatmapRenderableSeries has been made obsolete, and replaced with two new controls! The FastUniformHeatmapRenderableSeries, and the FastNonUniformHeatmapRenderableSeries.
These updated heatmap controls provide additional performance and features including:
The Filters API provides a lightweight API to allow you to create, or use custom filters with the SciChart DataSeries. Several built-in filters are included, such as:
Additional filters can be created by subclassing FilterBase. Filters wrap a DataSeries. When the original DataSeries updates, the filter triggers a recalculation and redraws the chart automatically.

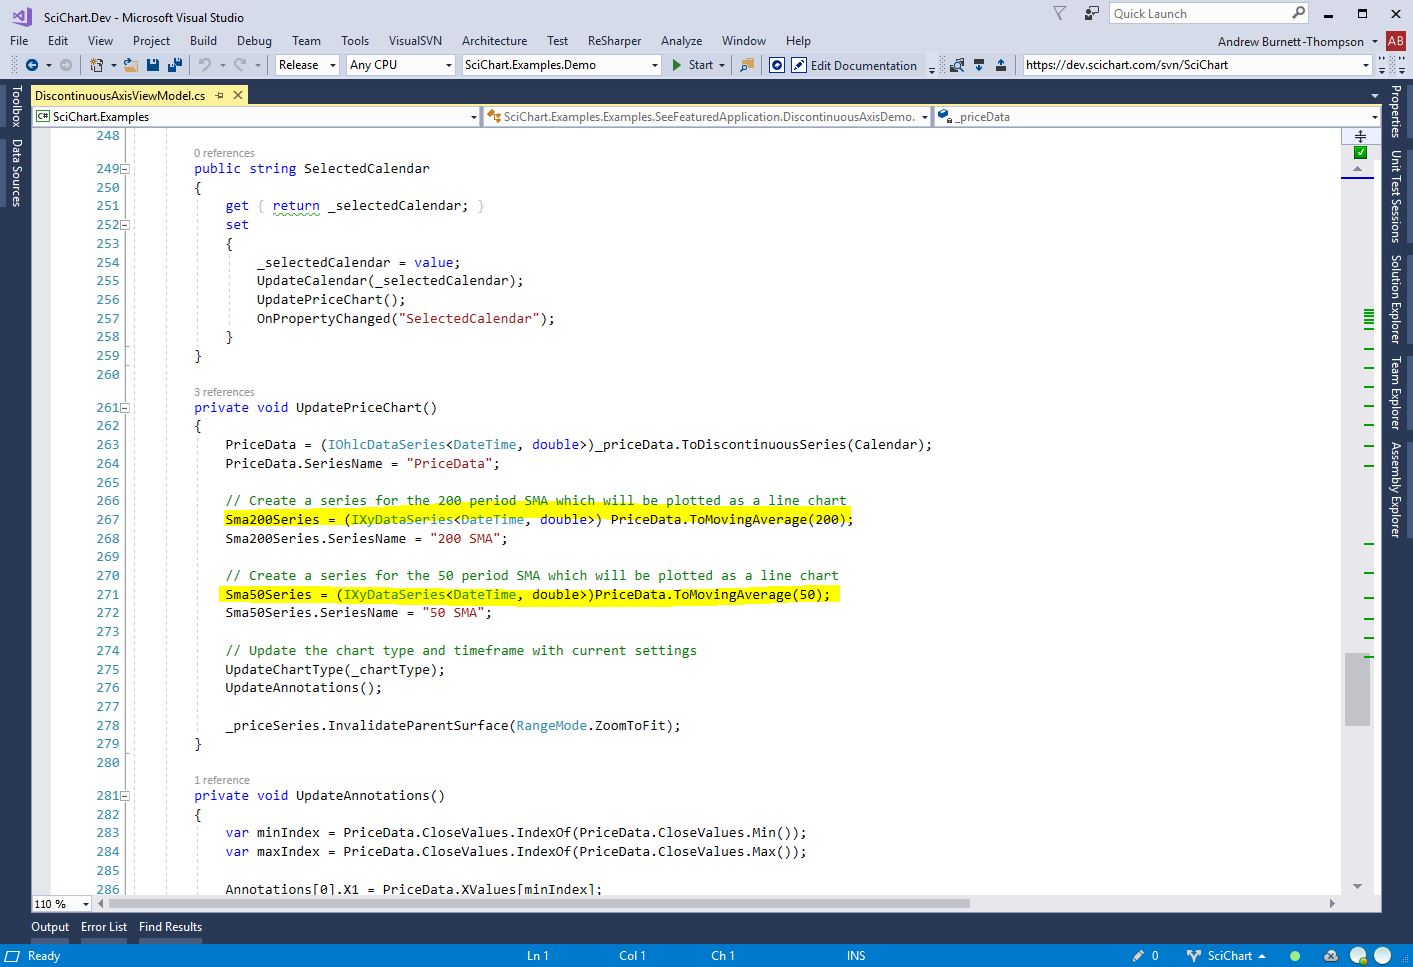
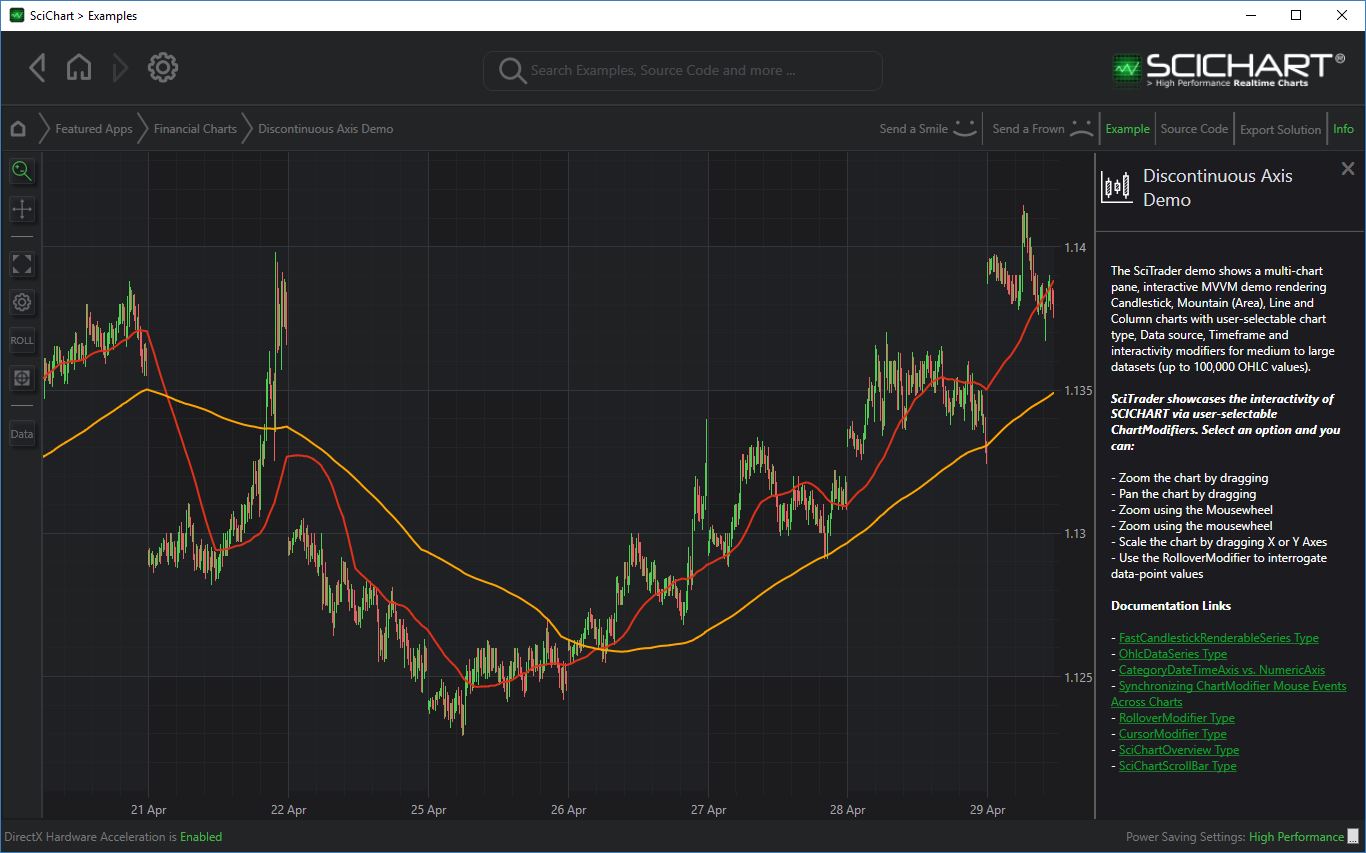
The DiscontinuousDateTimeAxis type has been added, which acts like a DateTimeAxis (value axis), but allows skipping certain dates according to a calendar. This axis type can be used to show trading/stock charts and hide blocks of time (such as weekends, overnight trading) from the chart. It accepts a custom calendar of skip times. Two pre-programmed calendars (NYSE, LSE) are also included.
This axis type may be used for non-trading systems, e.g. process management or control systems where a DateTimeAxis with hidden dates is required.
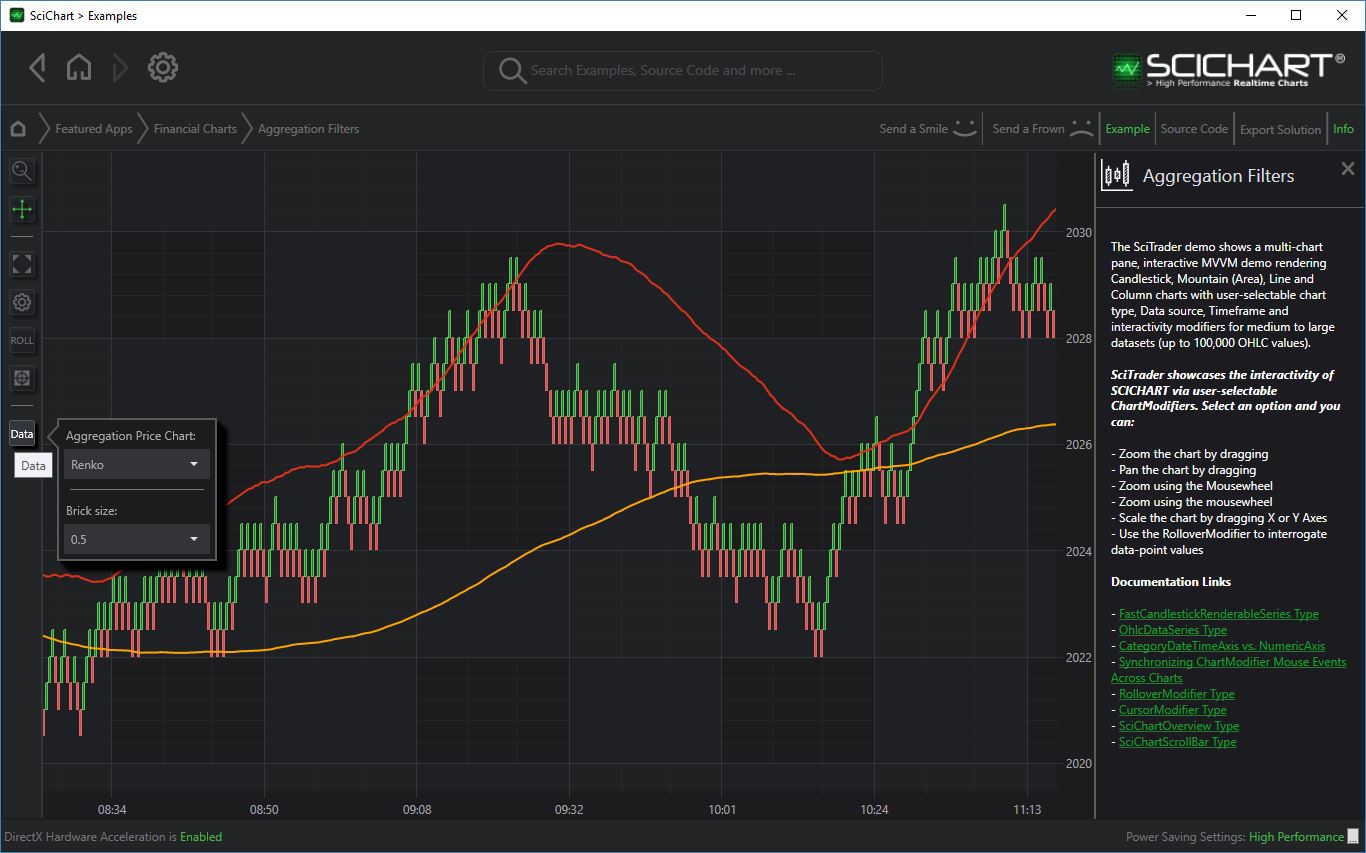
In combination with the AggregationFilter type, SciChart WPF can now render Range Bars, Volume Bars, Tick Bars, Renko Bars as well as Time Based Bars in the Aggregation Filters Example.
*This axis type is included in the SDK / Enterprise versions of SciChart only.
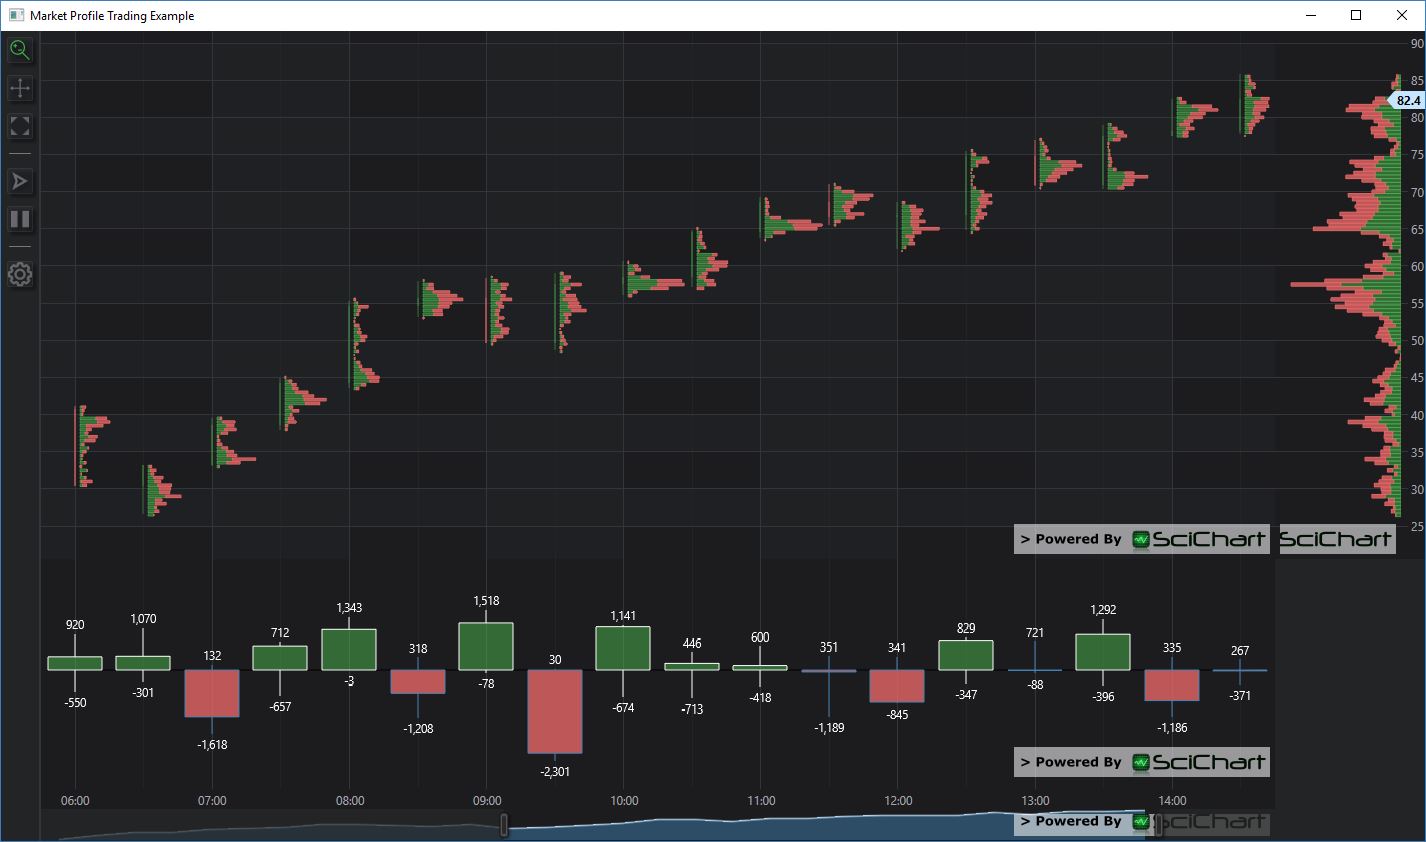
A new series type which renders a Market Profile: a histogram between Candlesticks to visualize trading volume data.
*This series type is included in the SDK / Enterprise versions of SciChart only.
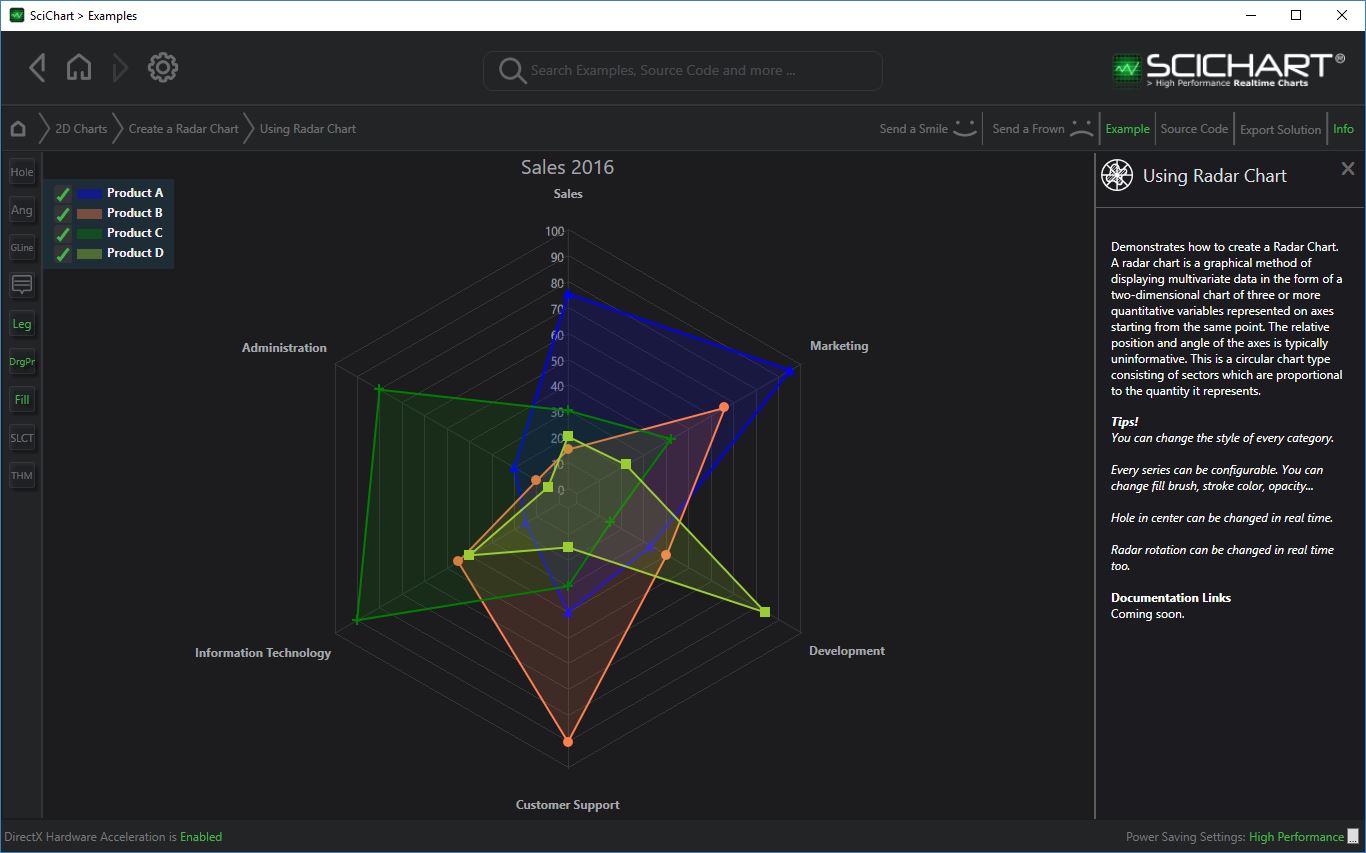
A Radar Chart type has been added, which allows customised axis to display relationships between datasets.

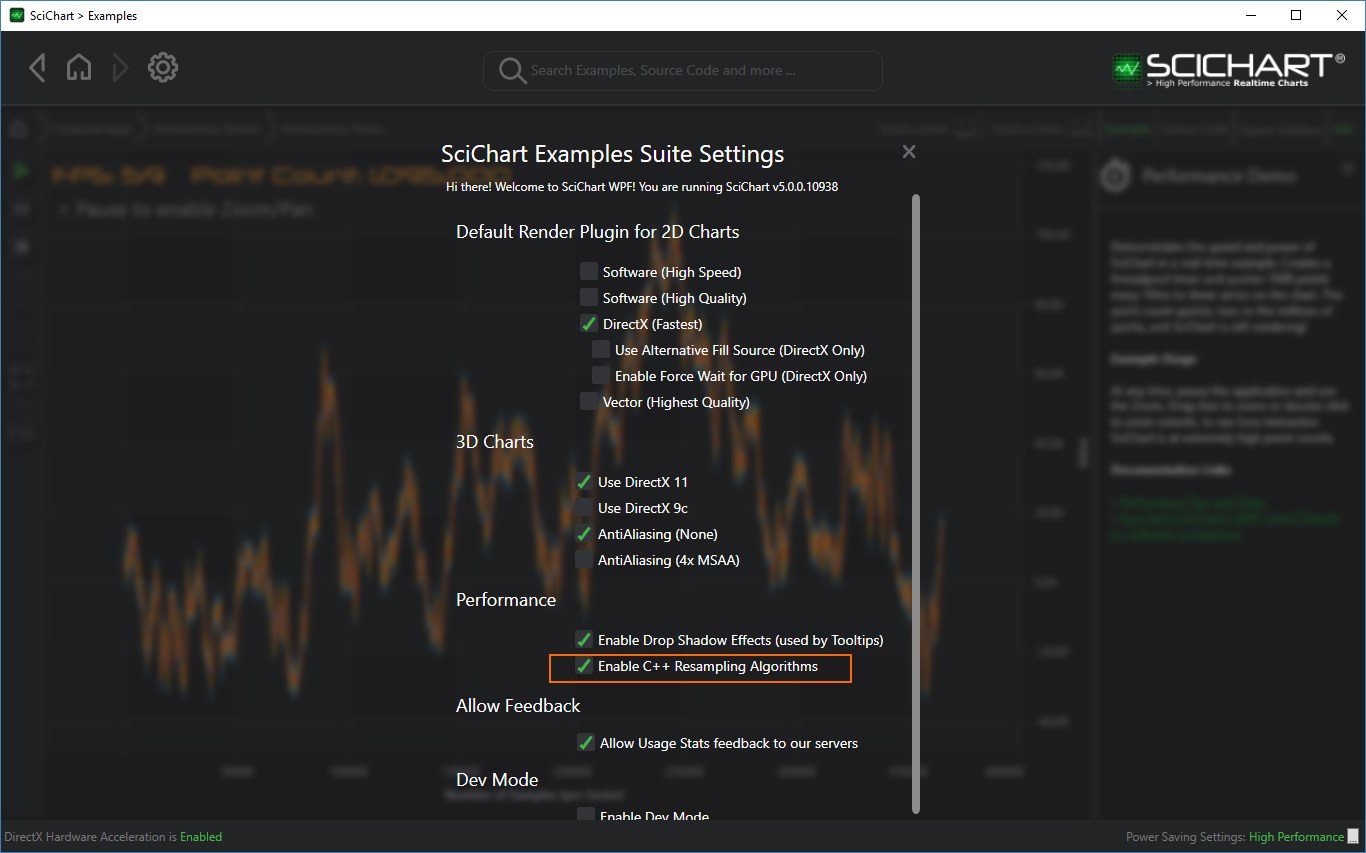
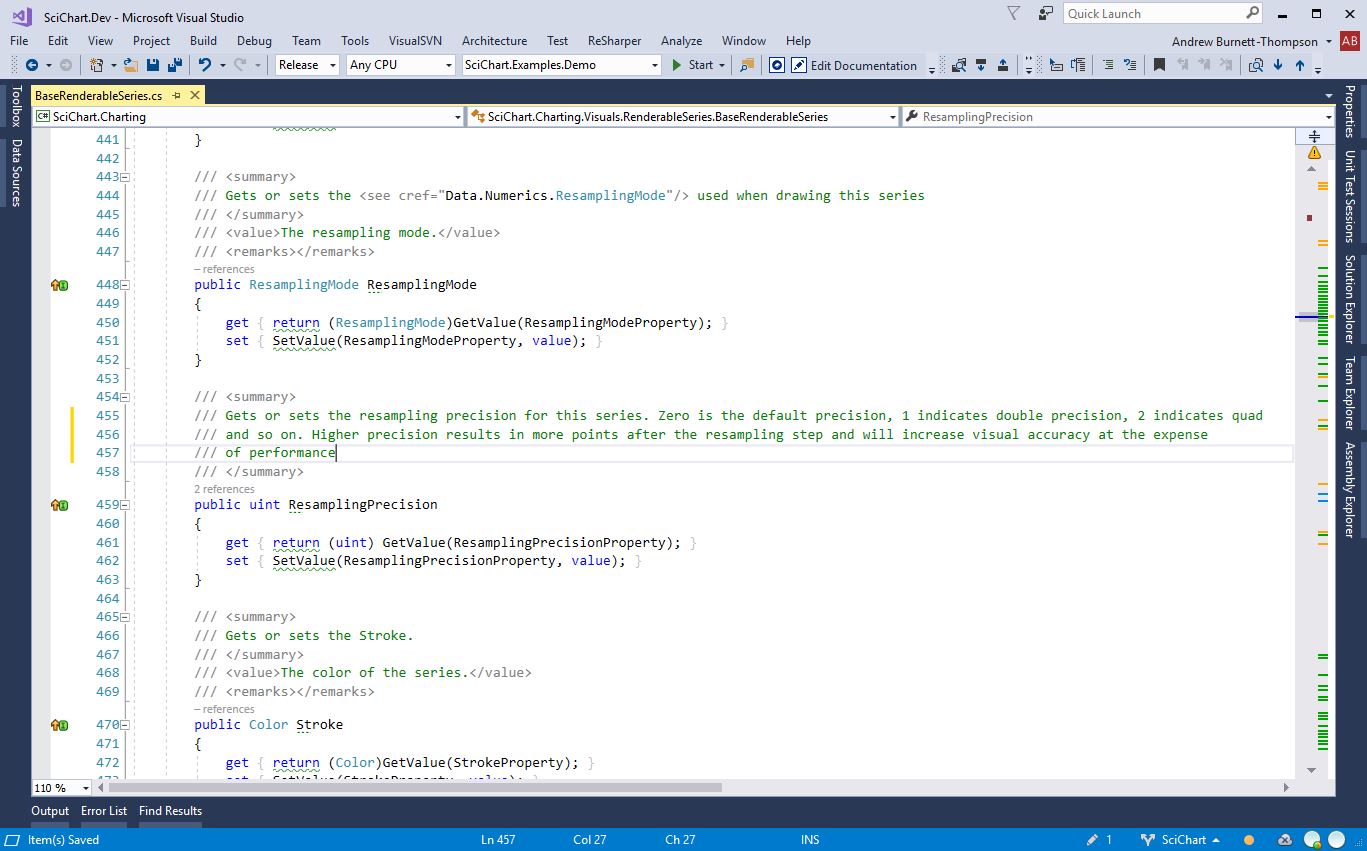
Our resampler algorithms have been re-written using C++ for enhanced resolution, speed and efficiency. Long standing problems solved include:
Multitouch has been improved in SciChart 2D Charts. The PinchZoomModifier now works flawlessly with the ZoomPanModifier. Accuracy and precision of MultiTouch has been improved.
SciChart 3D Charts get PinchZoomModifier3D.
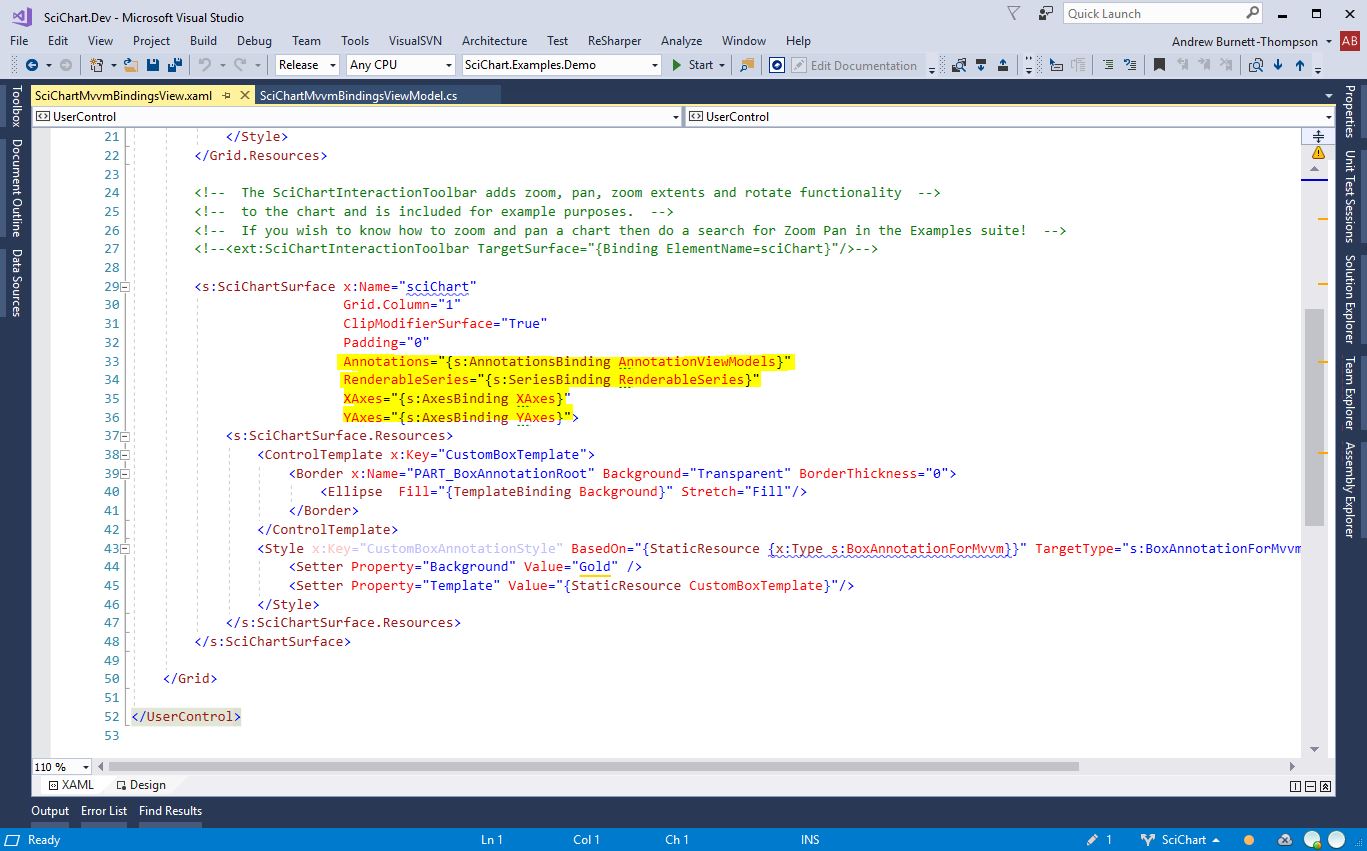
SciChart 2D Charts have new MVVM APIs. AxisBinding and AnnotationsBinding MarkupExtensions now complement our SeriesBinding API for MVVM developers.
SciChart 3D Charts get SeriesBinding3D and supports AxisBinding.

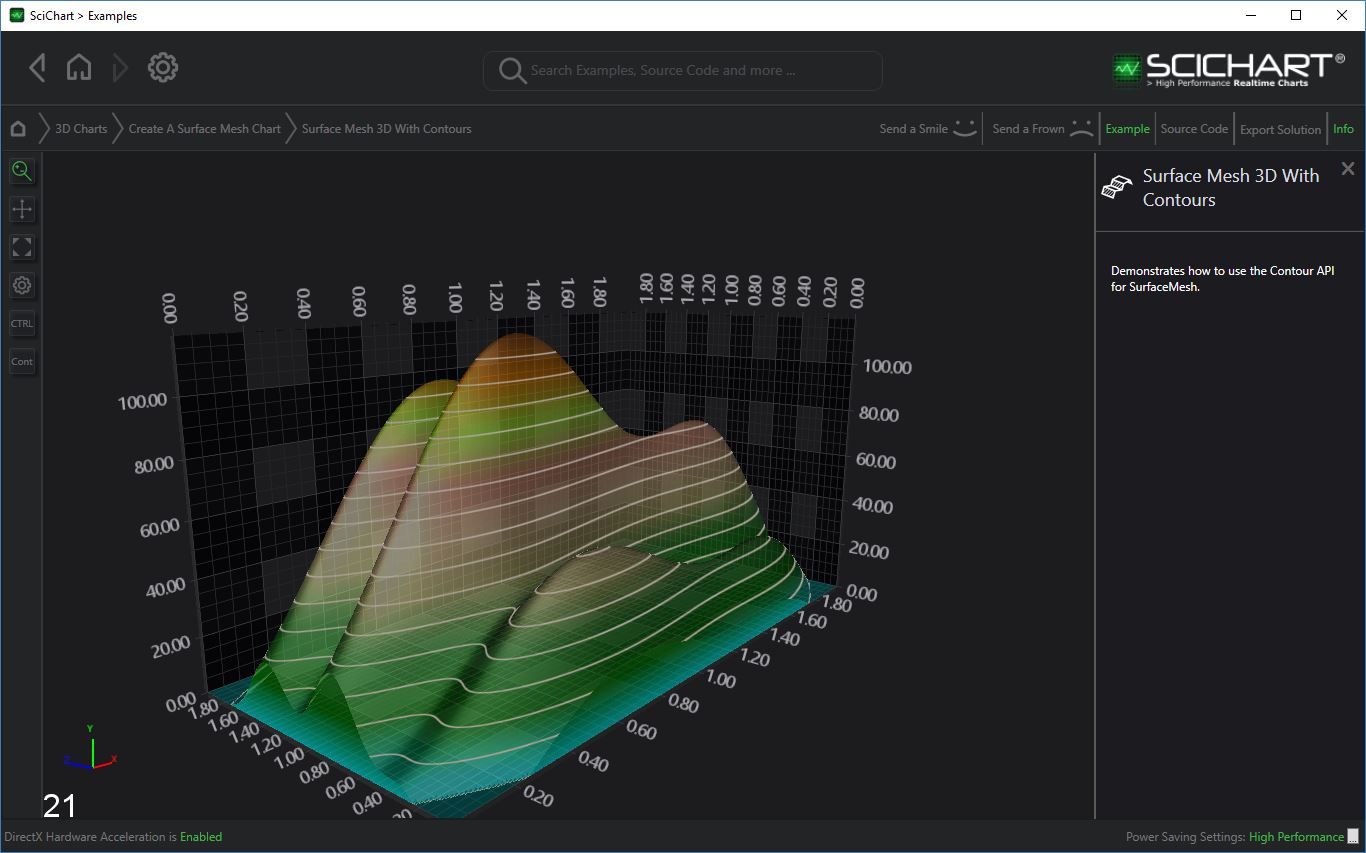
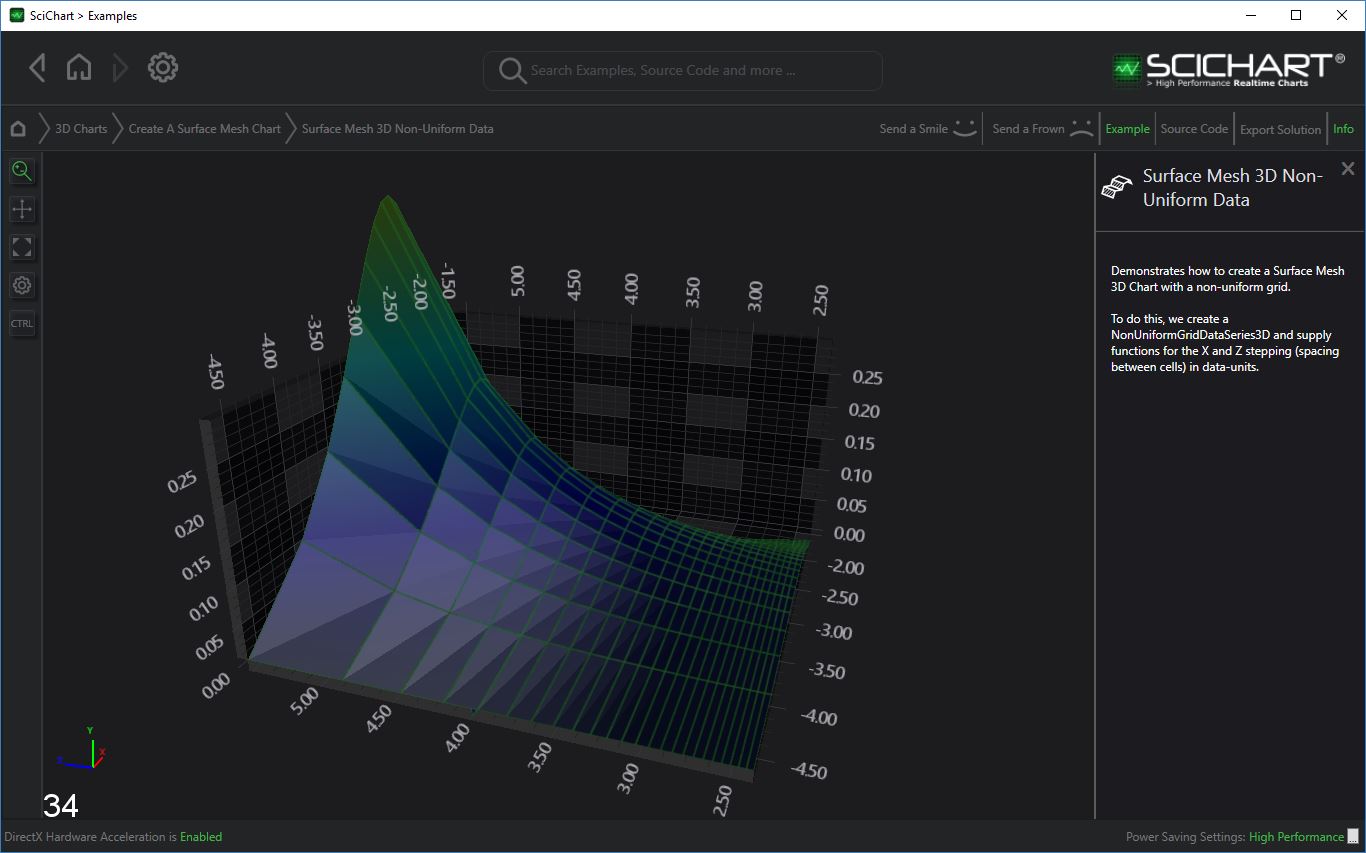
SurfaceMeshRenderableSeries3D now accepts a NonUniformGridDataSeries3D as well as a UniformGridDataSeries3D. Spacing data is provided for the X-Z plane allowing the surface mesh to be non-uniformly spaced.
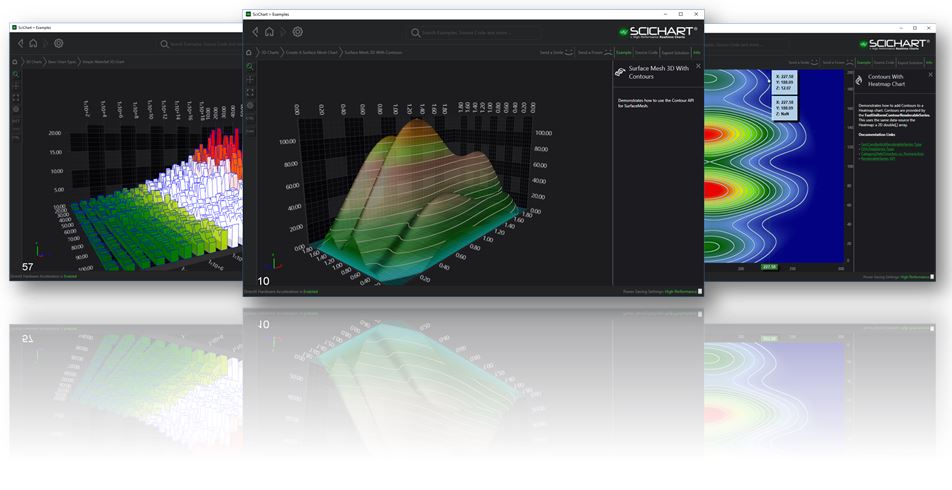
3D Surface mesh charts now support contours, wireframe, or both contours and wireframe. See our examples to see how this feature is applied.
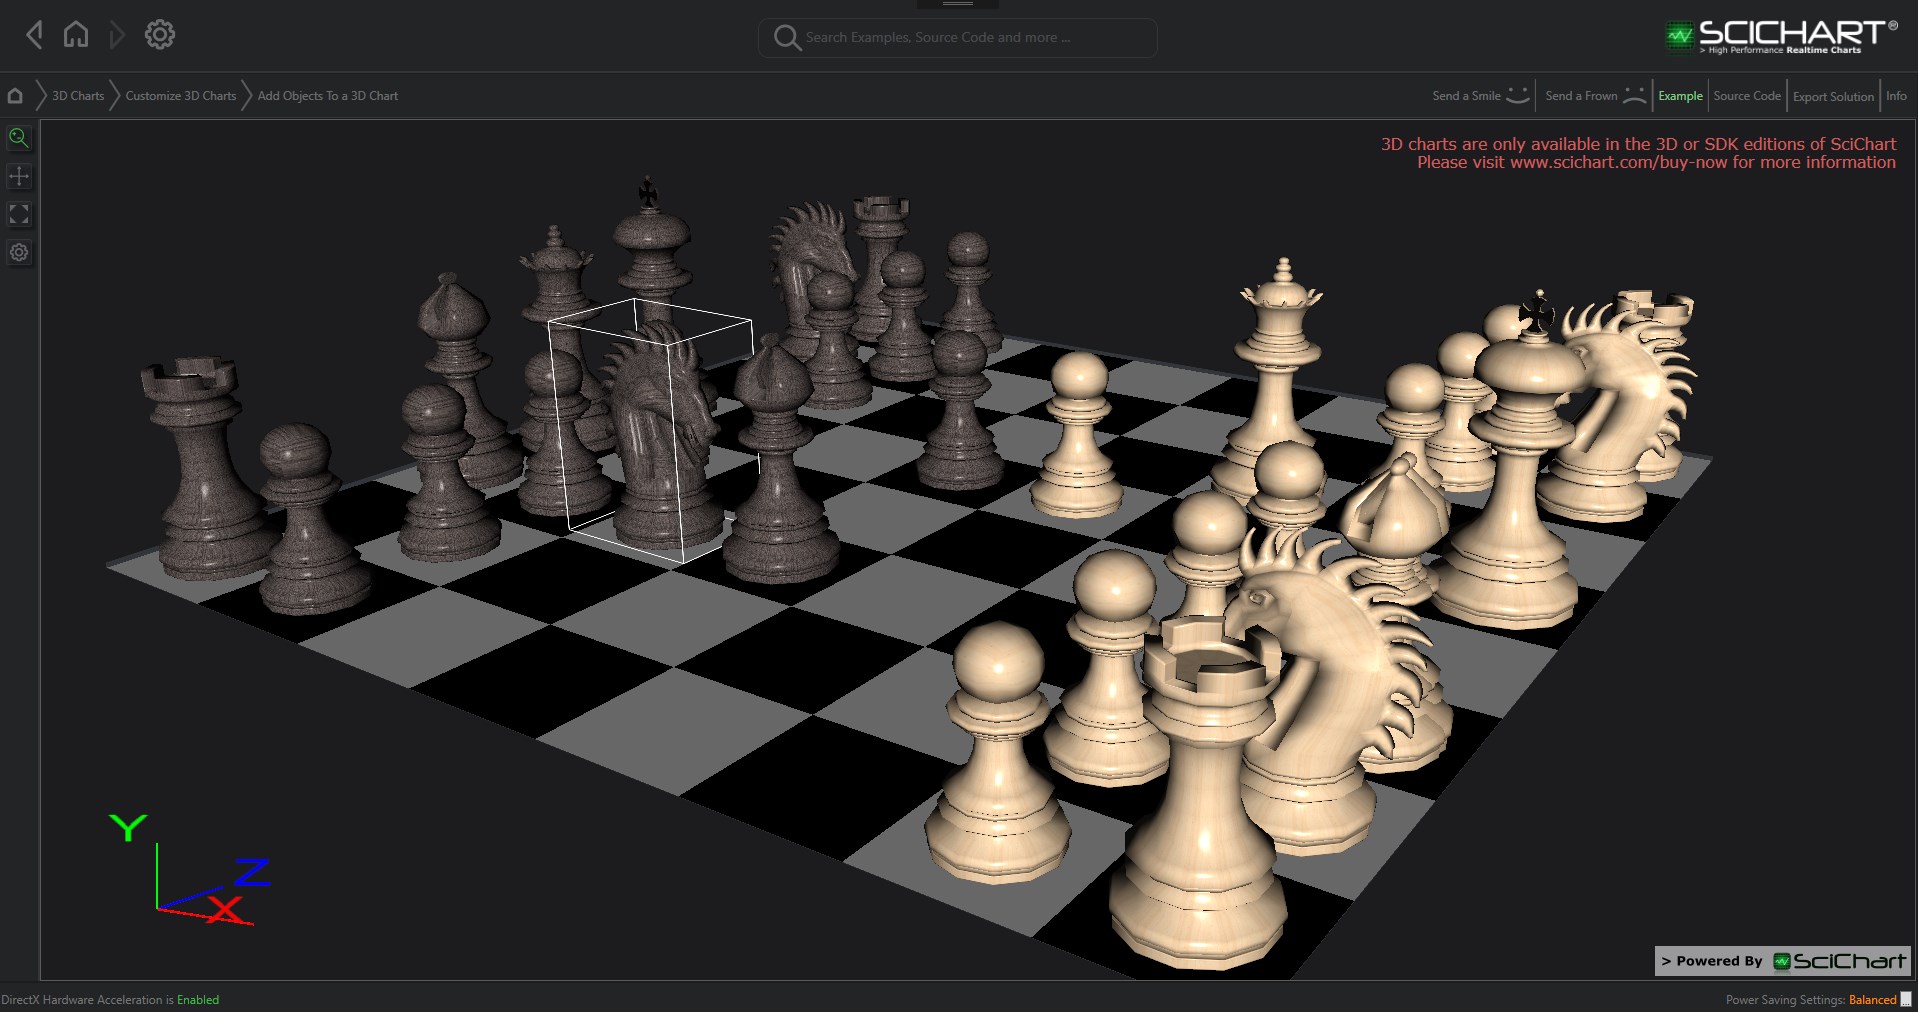
Textured 3D Objects may be added to a 3D Chart at specifix XYZ format. SciChart accepts the *.obj file format, or Obj file streamed from embedded resource.
A new 3D Chart Type called Waterfall3D has been added to the SciChart 3D library. This renders a UniformGridDataSeries3D as a series of waterfall slices. Waterfall charts support realtime scrolling & updating, as well as optional slice thickness, point-markers, selection and more.


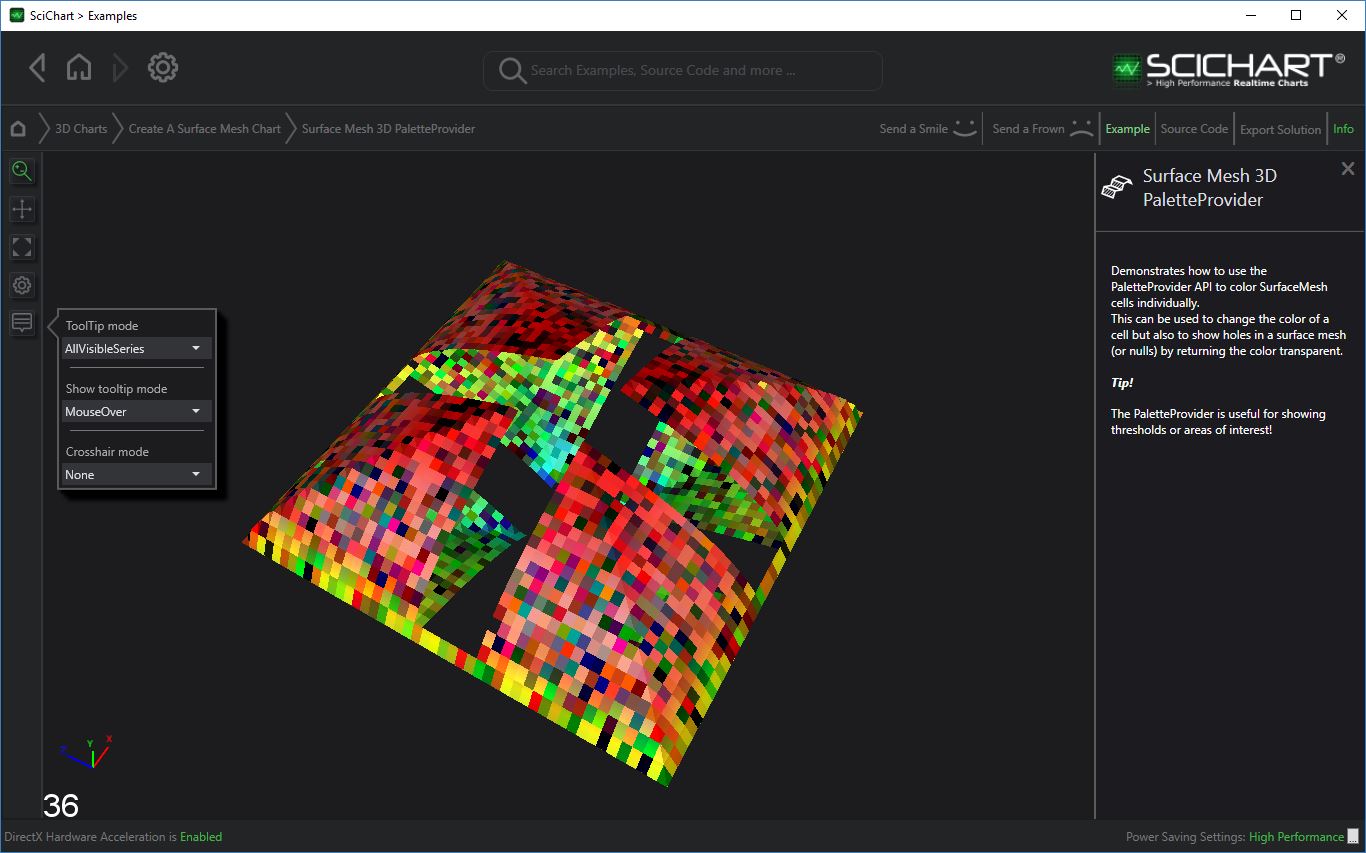
We’ve added the feature of nulls (empty cells) in surface mesh, as well as custom cell color override for the 3D Surface Mesh chart, by adding support for the PaletteProvider API.
Multiple improvements have been made to the 3D Charts APIs, visuals and usabilty, including:
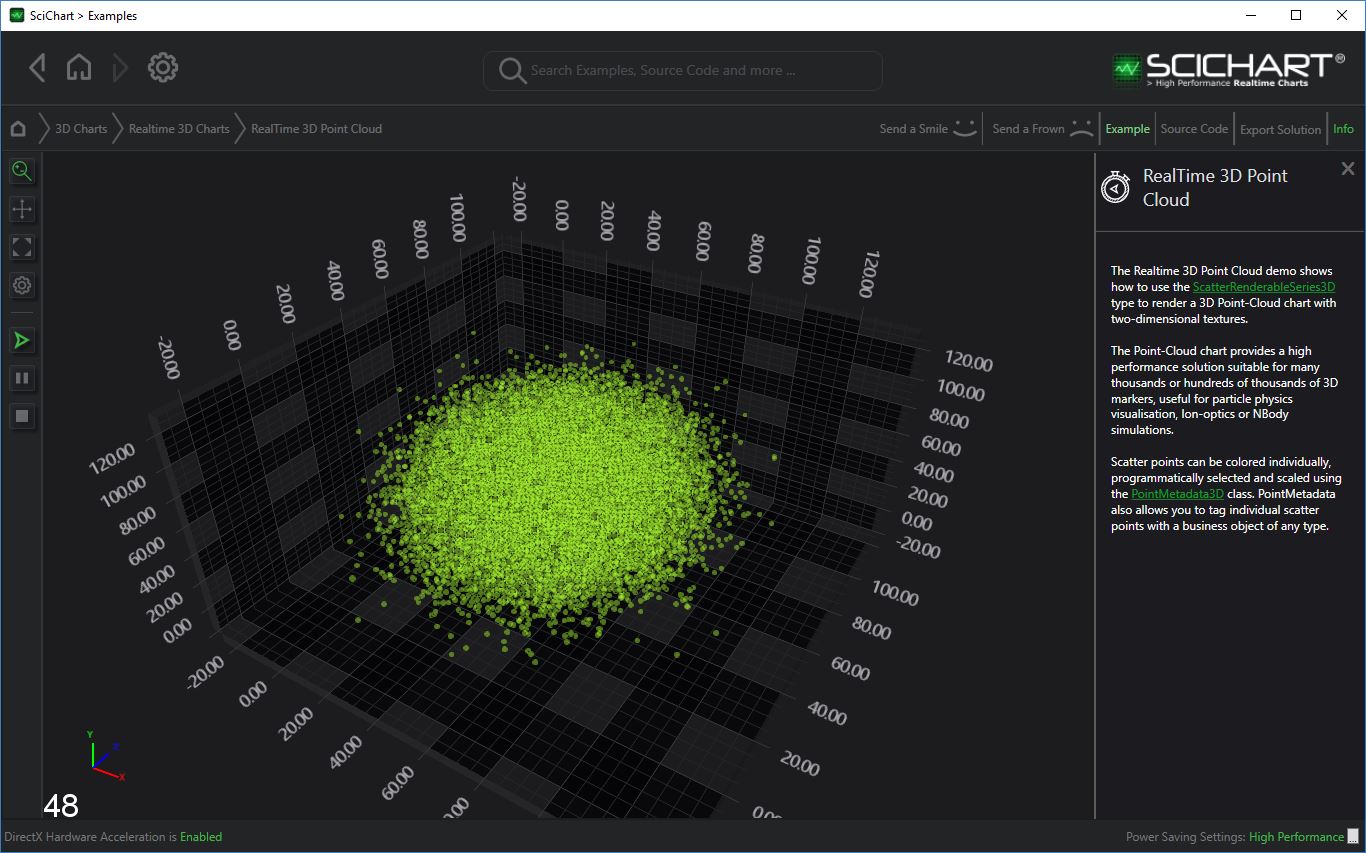
Several 3D Chart types have been optimized for larger datasets & higher throughput in realtime charting situations.
Optimizations include:
The minimum requirement for SciChart WPF v5 is now .NET4.5. From version 5 onward, we will no longer support .NET4.0. This is inline with Microsoft support guidelines, and allows us to use the later versions of SharpDX.
We decided to release now, as it has been a while since our last major update. Some features got missed from the release, but are in progress. These include:
Until December 31st 2017, we are offering new customers a 15% discount on new license purchases using the Coupon Code SCICHARTV5 on the last page before checkout.
Existing customers who wish to renew, if your support expiry is more than 1-year out of date, we can extend the renewal pricing (50%) as if your support recently expired.
Contact Sales to find out more about the above.
We hope you enjoy using SciChart WPF v5 as much as we have enjoyed making it! Give us your feedback as we would love to hear it!
Thanks and regards,
[SciChart Team]
Related Posts
![]()
Queens Award for Innovation
Proud winners of the Queens Award for Innovation, 2019. Awarded on account of our innovative graphics engine which underpins the SciChart library and enables our world-beating charting performance
![]()
National Business Awards
Highly Commended for Lloyds National Business Awards, 2019. Awarded on account of our innovative graphics engine and impressive customer base

Reviews
SciChart has received hundreds of verified, 3rd party reviews