WPF Chart - Examples
SciChart WPF ships with hundreds of WPF Chart Examples which you can browse, play with, view the source-code and even export each WPF Chart Example to a stand-alone Visual Studio solution. All of this is possible with the new and improved SciChart WPF Examples Suite, which ships as part of the SciChart WPF SDK.
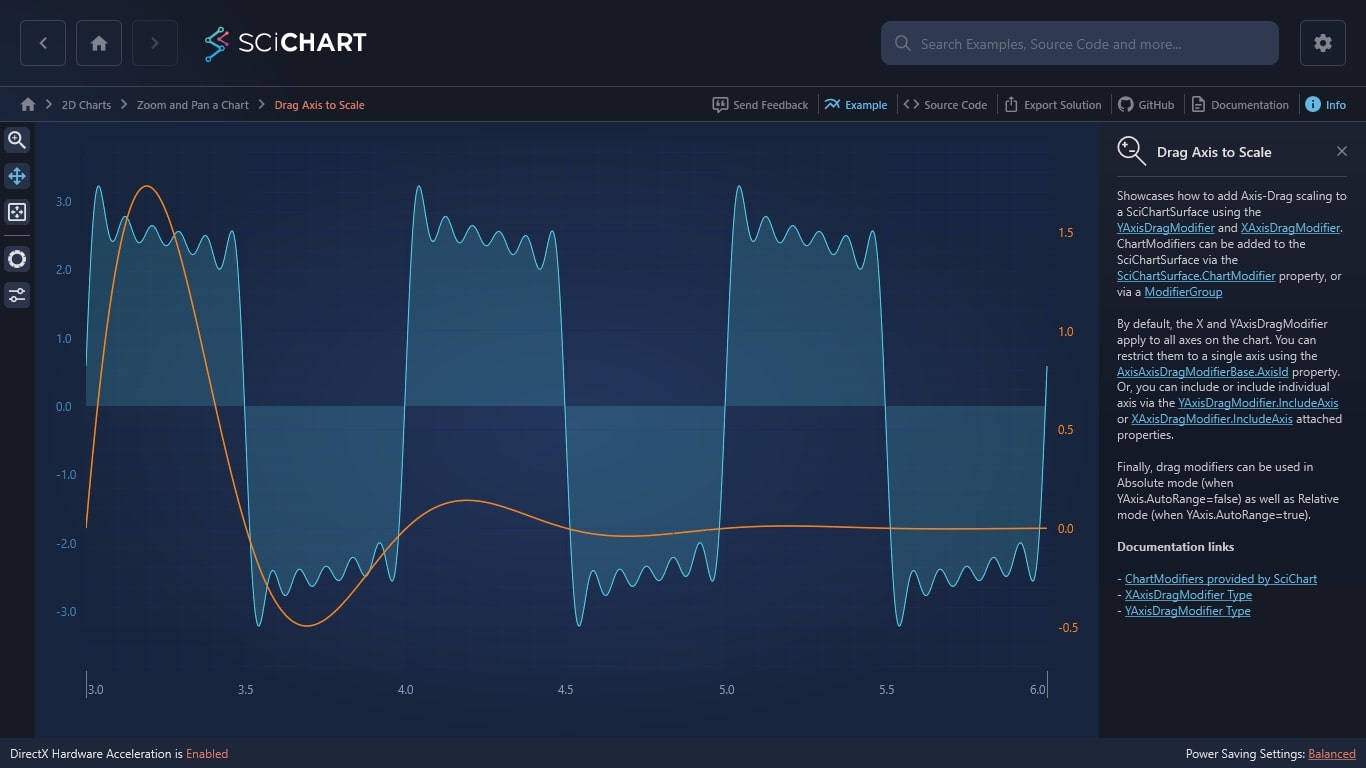
Showcases how to add Axis-Drag scaling to a SciChartSurface using the YAxisDragModifier and XAxisDragModifier. ChartModifiers can be added to the SciChartSurface via the SciChartSurface.ChartModifier property, or via a ModifierGroup
By default, the X and YAxisDragModifier apply to all axes on the chart. You can restrict them to a single axis using the AxisAxisDragModifierBase.AxisId property. Or, you can include or include individual axis via the YAxisDragModifier.IncludeAxis or XAxisDragModifier.IncludeAxis attached properties.
Finally, drag modifiers can be used in Absolute mode (when YAxis.AutoRange=false) as well as Relative mode (when YAxis.AutoRange=true).
Documentation links
– ChartModifiers provided by SciChart
– XAxisDragModifier Type
– YAxisDragModifier Type

The C#/WPF source code for the WPF Chart Drag Axis to Scale or Pan example is included below (Scroll down!).
Did you know you can also view the source code from one of the following sources as well?
- Clone the SciChart.WPF.Examples from Github.
- Or, view source in the SciChart WPF Examples suite.
- Also the SciChart WPF Trial contains the full source for the examples (link below).
