WPF Chart Performance
SciChart’s legendary WPF Chart performance is enabled by our proprietary, in-house, C++ cross platform 3D graphics engine, Visual Xccelerator. The engine is entirely hardware accelerated targetting DirectX on Windows platform.
You won’t find real-world WPF/.NET Chart performance quite like SciChart!
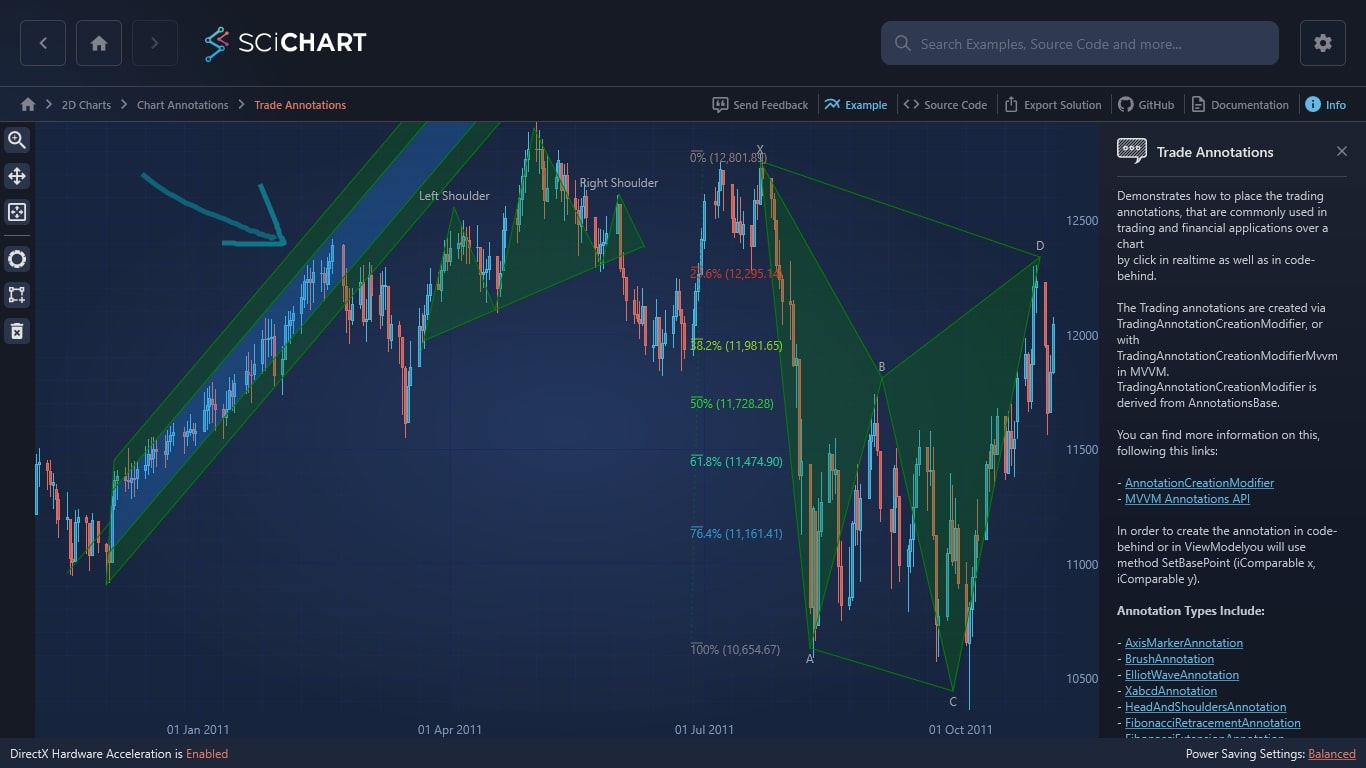
With SciChart’s WPF chart library, it is now possible to display millions, or even billions of data-points in WPF line, scatter, or candlestick charts and update in real-time. It’s also possible to display thousands of series, or hundreds of fast WPF Charts on a single UI without stalling the rest of your user interface.
Our high-performance WPF SciChart chart libraries are essential tools utilized by numerous online casinos, facilitating seamless data visualization and analysis within their platforms. These advanced charting capabilities enable online casinos to present complex data in a user-friendly format, enhancing the overall user experience. For instance, in the realm of 5 euro casino, where affordability and accessibility are key factors, our chart libraries play a pivotal role in presenting vital information to both operators and players. From tracking player activity to analyzing revenue trends, these charts offer valuable insights that drive strategic decision-making.
In the competitive landscape of online gambling, accurate data representation is crucial for making informed decisions. Our SciChart libraries empower casinos to display real-time data on various aspects such as player statistics, game performance, and financial transactions. This enables operators to monitor and optimize their platforms effectively.
Learn More