The FibonacciRetracementAnnotation
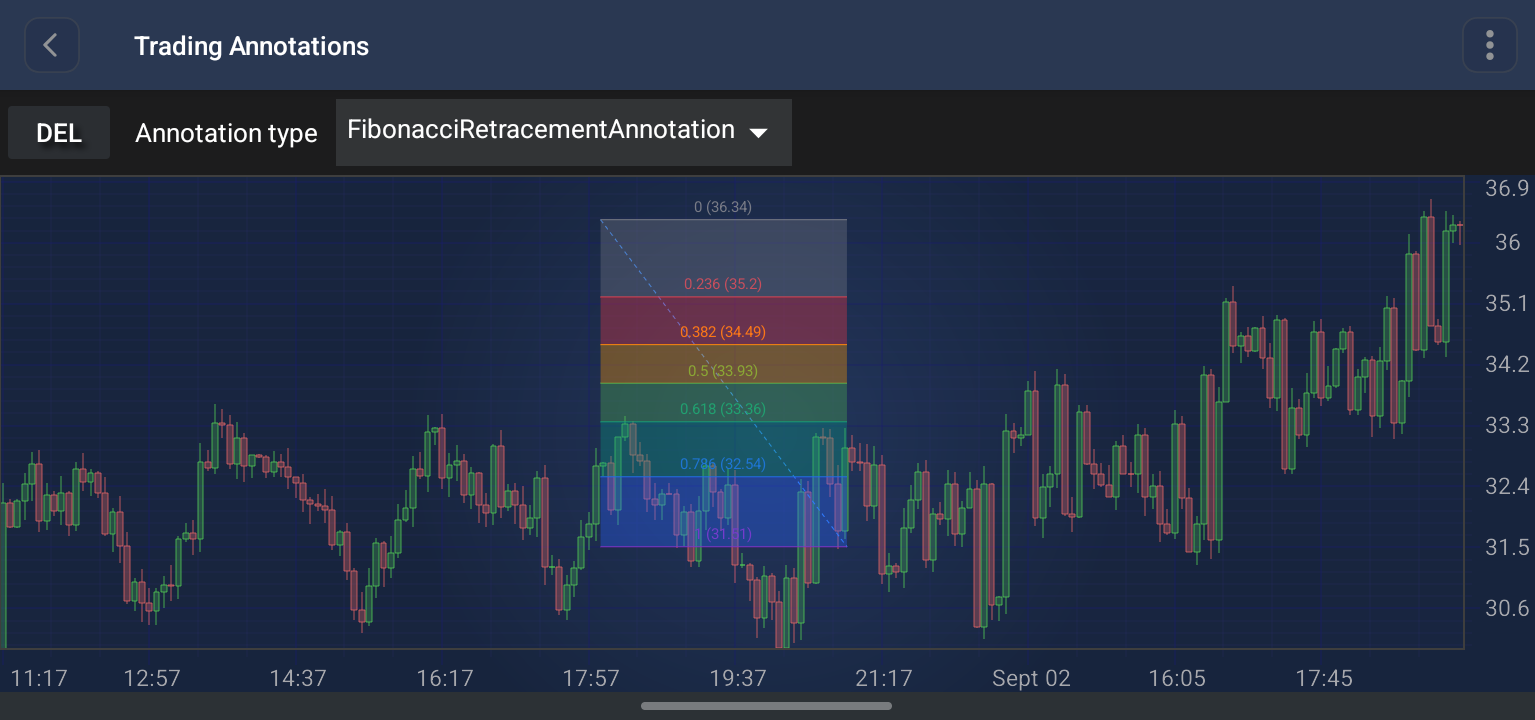
The FibonacciRetracementAnnotation is a specialized trading annotation that draws Fibonacci retracement levels across a price move defined by two points.
Note
Examples of the Annotations usage can be found in the SciChart Android Examples Suite as well as on GitHub:
Structure and Points
The FibonacciRetracementAnnotation is defined by two anchor points - the start and the end of the price move:
- Point 0: The start of the move, corresponding to the 0.0 ratio.
- Point 1: The end of the move, corresponding to the 1.0 ratio.
For every configured ratio, a horizontal level line is drawn spanning the X range between the two points, at the price:
levelValue = y0 + ratio * (y1 - y0)
Each level line carries a text label, and a translucent fill band is drawn between every pair of adjacent levels. A dashed connector line joins the two anchor points diagonally.
Levels and Colors
The set of ratios is controlled by the levels property, which defaults to the classic Fibonacci sequence:
0.0, 0.236, 0.382, 0.5, 0.618, 0.786, 1.0
Colors are assigned per level from the levelColors list. The list is cycled if it is shorter than the level count, so any number of levels is supported. Each level's color applies to its line, its label text (unless overridden) and the band drawn below it.
Note
Assigning a new list to levels rebuilds the level lines, labels and bands, so the annotation can be re-configured at any time after it has been created.
Label Configuration
Labels are configured with three enumerations:
| Property | Description |
|---|---|
| labelPlacement | SIDE places each label beside the visually-left anchor point, right-aligned against the level line. CENTER centers each label horizontally between the two anchor points. Defaults to SIDE. |
| labelFormat | RATIO formats the text as the raw ratio followed by the price, e.g. 0.786 (66K). PERCENT formats the ratio as a percentage followed by the price, e.g. 78.6% 66K. Defaults to null - the format follows labelPlacement (see below). |
| labelVerticalPosition | ABOVE, ON_LINE or BELOW - where the label sits vertically relative to its level line. Defaults to ON_LINE. |
When labelFormat is left as null, the format is chosen automatically from the placement - RATIO for SIDE placement, PERCENT for CENTER placement.
Prices of 1000 and above are abbreviated with a K suffix in the label text.
Appearance Properties
The following properties can be used to customize the appearance of the FibonacciRetracementAnnotation:
| Property | Description |
|---|---|
| levels | The list of Fibonacci ratios to draw. Defaults to 0.0, 0.236, 0.382, 0.5, 0.618, 0.786, 1.0. |
| levelColors | The per-level colors, cycled if shorter than the number of levels. |
| fillOpacity | The opacity of the fill bands between adjacent levels, in the [0 to 1] range. Defaults to 0.35. |
| strokeThickness | The thickness of the level lines. |
| stroke | Provides the color of the dashed connector line joining the two anchor points. The level lines take their colors from levelColors instead. |
| showConnectorLine | Shows or hides the dashed connector line. Defaults to true. |
| labelFontSize | The font size of the level labels. Defaults to 15. |
| labelTextColor | An override for the label text color. Pass null to have each label follow its level's line color. |
| labelBackgroundColor | An override for the label background color. Pass null to render the labels with no background. |
Note
The xAxisId and yAxisId must be supplied if you have axis with non-default Axis Ids, e.g. in multi-axis scenario.
Create a FibonacciRetracementAnnotation
A FibonacciRetracementAnnotation can be added onto a chart using the following code:
// Assume a surface has been created and configured somewhere
// Create a FibonacciRetracementAnnotation
final FibonacciRetracementAnnotation fibonacciRetracementAnnotation = new FibonacciRetracementAnnotation(getContext());

// Allow to interact with the annotation in run-time
fibonacciRetracementAnnotation.setIsEditable(true);

// Specify the Fibonacci ratios to draw and the color of each level
fibonacciRetracementAnnotation.setLevels(Arrays.asList(0d, 0.236, 0.382, 0.5, 0.618, 0.786, 1d));
fibonacciRetracementAnnotation.setLevelColors(Arrays.asList(
        Color.parseColor("#787B86"),
        Color.parseColor("#F23645"),
        Color.parseColor("#FF9800"),
        Color.parseColor("#4CAF50"),
        Color.parseColor("#089981"),
        Color.parseColor("#2962FF"),
        Color.parseColor("#9C27B0")));

// Specify the appearance of the level lines and of the fill bands between them
fibonacciRetracementAnnotation.setStrokeThickness(1.5f);
fibonacciRetracementAnnotation.setFillOpacity(0.35f);

// The stroke provides the color of the dashed connector line between the two anchor points
fibonacciRetracementAnnotation.setStroke(new SolidPenStyle(Color.WHITE, true, 1f, null));
fibonacciRetracementAnnotation.setShowConnectorLine(true);

// Configure how each level's label is placed and formatted
fibonacciRetracementAnnotation.setLabelPlacement(FibonacciRetracementAnnotation.LabelPlacement.CENTER);
fibonacciRetracementAnnotation.setLabelFormat(FibonacciRetracementAnnotation.LabelFormat.RATIO);
fibonacciRetracementAnnotation.setLabelVerticalPosition(FibonacciRetracementAnnotation.LabelVerticalPosition.ABOVE);
fibonacciRetracementAnnotation.setLabelFontSize(15f);

// Add 2 points which define the price move being retraced
fibonacciRetracementAnnotation.setBasePoint(10, 30.4); // Point 0 - the 0.0 ratio
fibonacciRetracementAnnotation.setBasePoint(30, 32.2); // Point 1 - the 1.0 ratio

// Add the annotation to the AnnotationsCollection of a surface
surface.getAnnotations().add(fibonacciRetracementAnnotation);
Note
For interactive creation of the FibonacciRetracementAnnotation, use the FibonacciRetracementAnnotationCreationModifier.
Note
To learn more about other Annotation Types, available out of the box in SciChart, please find the comprehensive list in the Annotation APIs article.