Annotations API
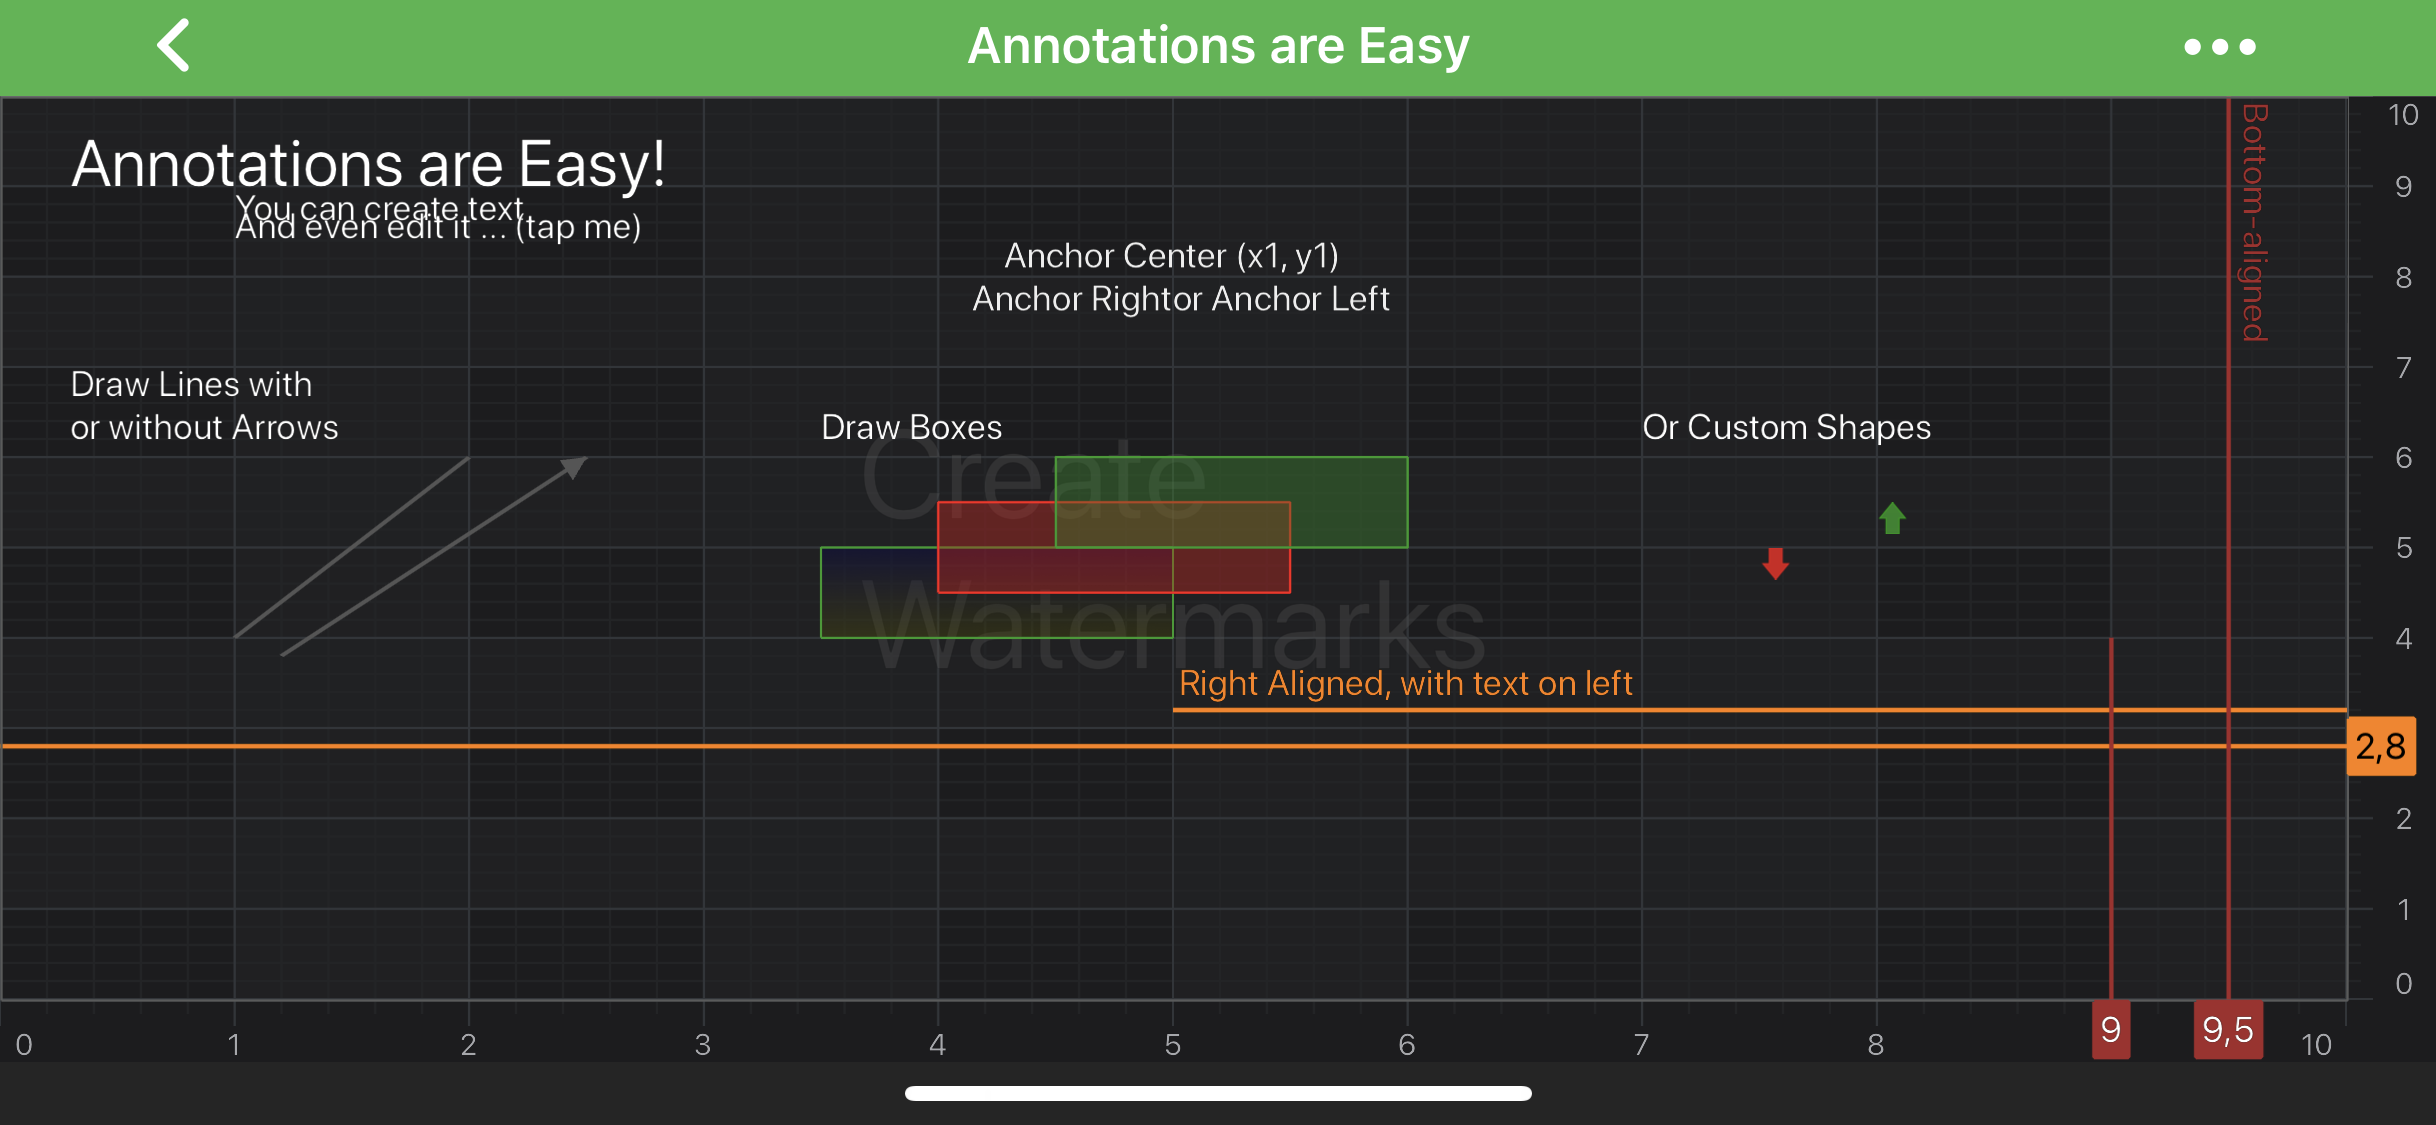
SciChart features a rich Annotations API, that allows you to place different elements over a chart:
Note
Examples of the Annotations usage can be found in the SciChart Android Examples Suite as well as on GitHub:
There are many different Annotations provided by SciChart and each one deserves an article by itself! This article is concerned with simply giving an overview of the annotations and where you can find the examples in our SciChart Android Examples Suite which demonstrate them.
The annotations which are available out the box in SciChart are listed below:
| Annotation Type | Description | |
|---|---|---|
| BoxAnnotation | Draws a rectangle at specific X1, X2, Y1, Y2 coordinates. |
|
| LineAnnotation | Draws a line between [X1, Y1] and [X2, Y2] coordinates. |
|
| LineArrowAnnotation | Draws an arrow from [X1, Y1] to [X2, Y2] coordinates. |
|
| HorizontalLineAnnotation | Draws a horizontal line between [X1, Y1] and [X2, Y2] coordinates. |
|
| VerticalLineAnnotation | Draws a vertical line between [X1, Y1] and [X2, Y2] coordinates. |
|
| TextAnnotation | Allows to place a piece of text at specific [X1, Y1] coordinates on a chart. |
|
| AxisLabelAnnotation | Allows to place a piece of text at specific X1 or Y1 coordinate on a chart Axis. |
|
| AxisMarkerAnnotation | Allows to place markers with custom text onto X or Y axes. By default, shows the axis value at its location. |
|
| CustomAnnotation | Allows to place any UIView at a specific [X1, Y1] coordinates on a chart. |
Note
To learn more about Annotation API, please read the Common Annotations Features section. To find out more about a specific Annotation Type, please refer to a corresponding article about this Annotation type.
Adding an Annotation Onto a Chart
The SciChartSurface stores all its annotations in the internal AnnotationCollection. It exposes the getAnnotations() property to access it.
The following code can be used to add the LineAnnotation to the chart:
// Assume a surface has been created and configured somewhere
// Create a Line Annotation
final LineAnnotation lineAnnotation = new LineAnnotation(getContext());

// Allow to interact with the annotation in run-time
lineAnnotation.setIsEditable(true);

// In a multi-axis scenario, specify the XAxisId and YAxisId
lineAnnotation.setXAxisId("TopAxisId");
lineAnnotation.setYAxisId("LeftAxisId");

// Specify a desired position by setting coordinates
lineAnnotation.setCoordinateMode(AnnotationCoordinateMode.RelativeY);
lineAnnotation.setX1(20);
lineAnnotation.setY1(0.2);
lineAnnotation.setX2(60);
lineAnnotation.setY2(0.8);

// Specify the stroke color for the annotation
lineAnnotation.setStroke(new SolidPenStyle(0x9942AD42, true, 4f, null));

// Add the annotation to the Annotations collection of the surface
surface.getAnnotations().add(lineAnnotation);
Common Annotations Features
All the Annotation classes provided by SciChart conforms to the IAnnotation protocol and derive from the AnnotationBase class. These provide an API which allows to put them onto a chart and interact with them.
Note
Please refer to the beginning of this article for the complete list of all the Annotation types available out of the box in SciChart.
Please see the list of common features below:
| Feature | Description |
|---|---|
| x1, y1, x2, y2 | [X1, X2, Y1, Y2] coordinates specifies the position of an annotation on a SciChartSurface. These are chart coordinates, not device (screen or pixel) coordinates. To find out about coordinate transformation in SciChart, please refer to the Convert Pixels to Data Coordinates article. |
| xAxisId, yAxisId | Specifies the ID of X-Axis and Y-Axis that this annotation is measured against. |
| isSelected | Defines whether the annotation is Selected. When Selected - round resizing markers appears at the ends or corners of the annotation which can be used to resize it. Resizing markers can be accessed via the resizingGrip property |
| isEditable | Specifies whether an annotation is available for interaction. When Editable, the annotation can be Selected, Moved and Resized by a user with a touch interaction. |
| isHidden | Hides or shows an annotation. |
| dragDirections | Allows to constrain drag directions for an annotation. Accepts a member of the Direction2D enumeration. |
| resizeDirections | Allows to constrain resize directions for an annotation. Accepts a member of the Direction2D enumeration. |
| coordinateMode | Determines whether [X1, X2, Y1, Y2] coordinates are in chart coordinates or in relative screen coordinates. Relative coordinates range from [0 to 1], where 1 refers to the full Width or Height of the canvas. Absolute coordinates are the data-values which must correspond to the Axis Type. Defined by the AnnotationCoordinateMode enumeration. |
| resizingGrip | Determines what resizing markers look like. Custom ones have to implement IResizingGrip. |
| annotationSurface | Specifies a surface to place an annotation on. Possible options are declared by the AnnotationSurfaceEnum enumeration. |
Note
The xAxisId and yAxisId must be supplied if you have axis with non-default Axis Ids.
Below is the list of some methods and listeners:
| Feature | Description |
|---|---|
| update(IAxis xAxis, IAxis yAxis) | Redraws an annotation without invalidating the parentSurface of the IAnnotation instance. |
| moveAnnotation(float horizOffset, float vertOffset) | Moves an annotation by the specified X and Y delta in horizontal and vertical directions. |
| setOnAnnotationDragListener(OnAnnotationDragListener listener) | Allows to appoint OnAnnotationDragListener to receive notifications about user interactions with an annotation. |
| setOnAnnotationSelectionChangeListener(OnAnnotationSelectionChangeListener listener) | Allows to appoint OnAnnotationSelectionChangeListener to receive notifications when the annotation selection has changed |
| setOnAnnotationIsHiddenChangeListener(OnAnnotationIsHiddenChangeListener listener) | Allows to appoint OnAnnotationIsHiddenChangeListener to receive notifications when an annotation gets hidden or visible. |
Note
To find out more about a specific Annotation Type, please refer to a corresponding article about this Annotation type.
Annotation Alignment (Anchor Points)
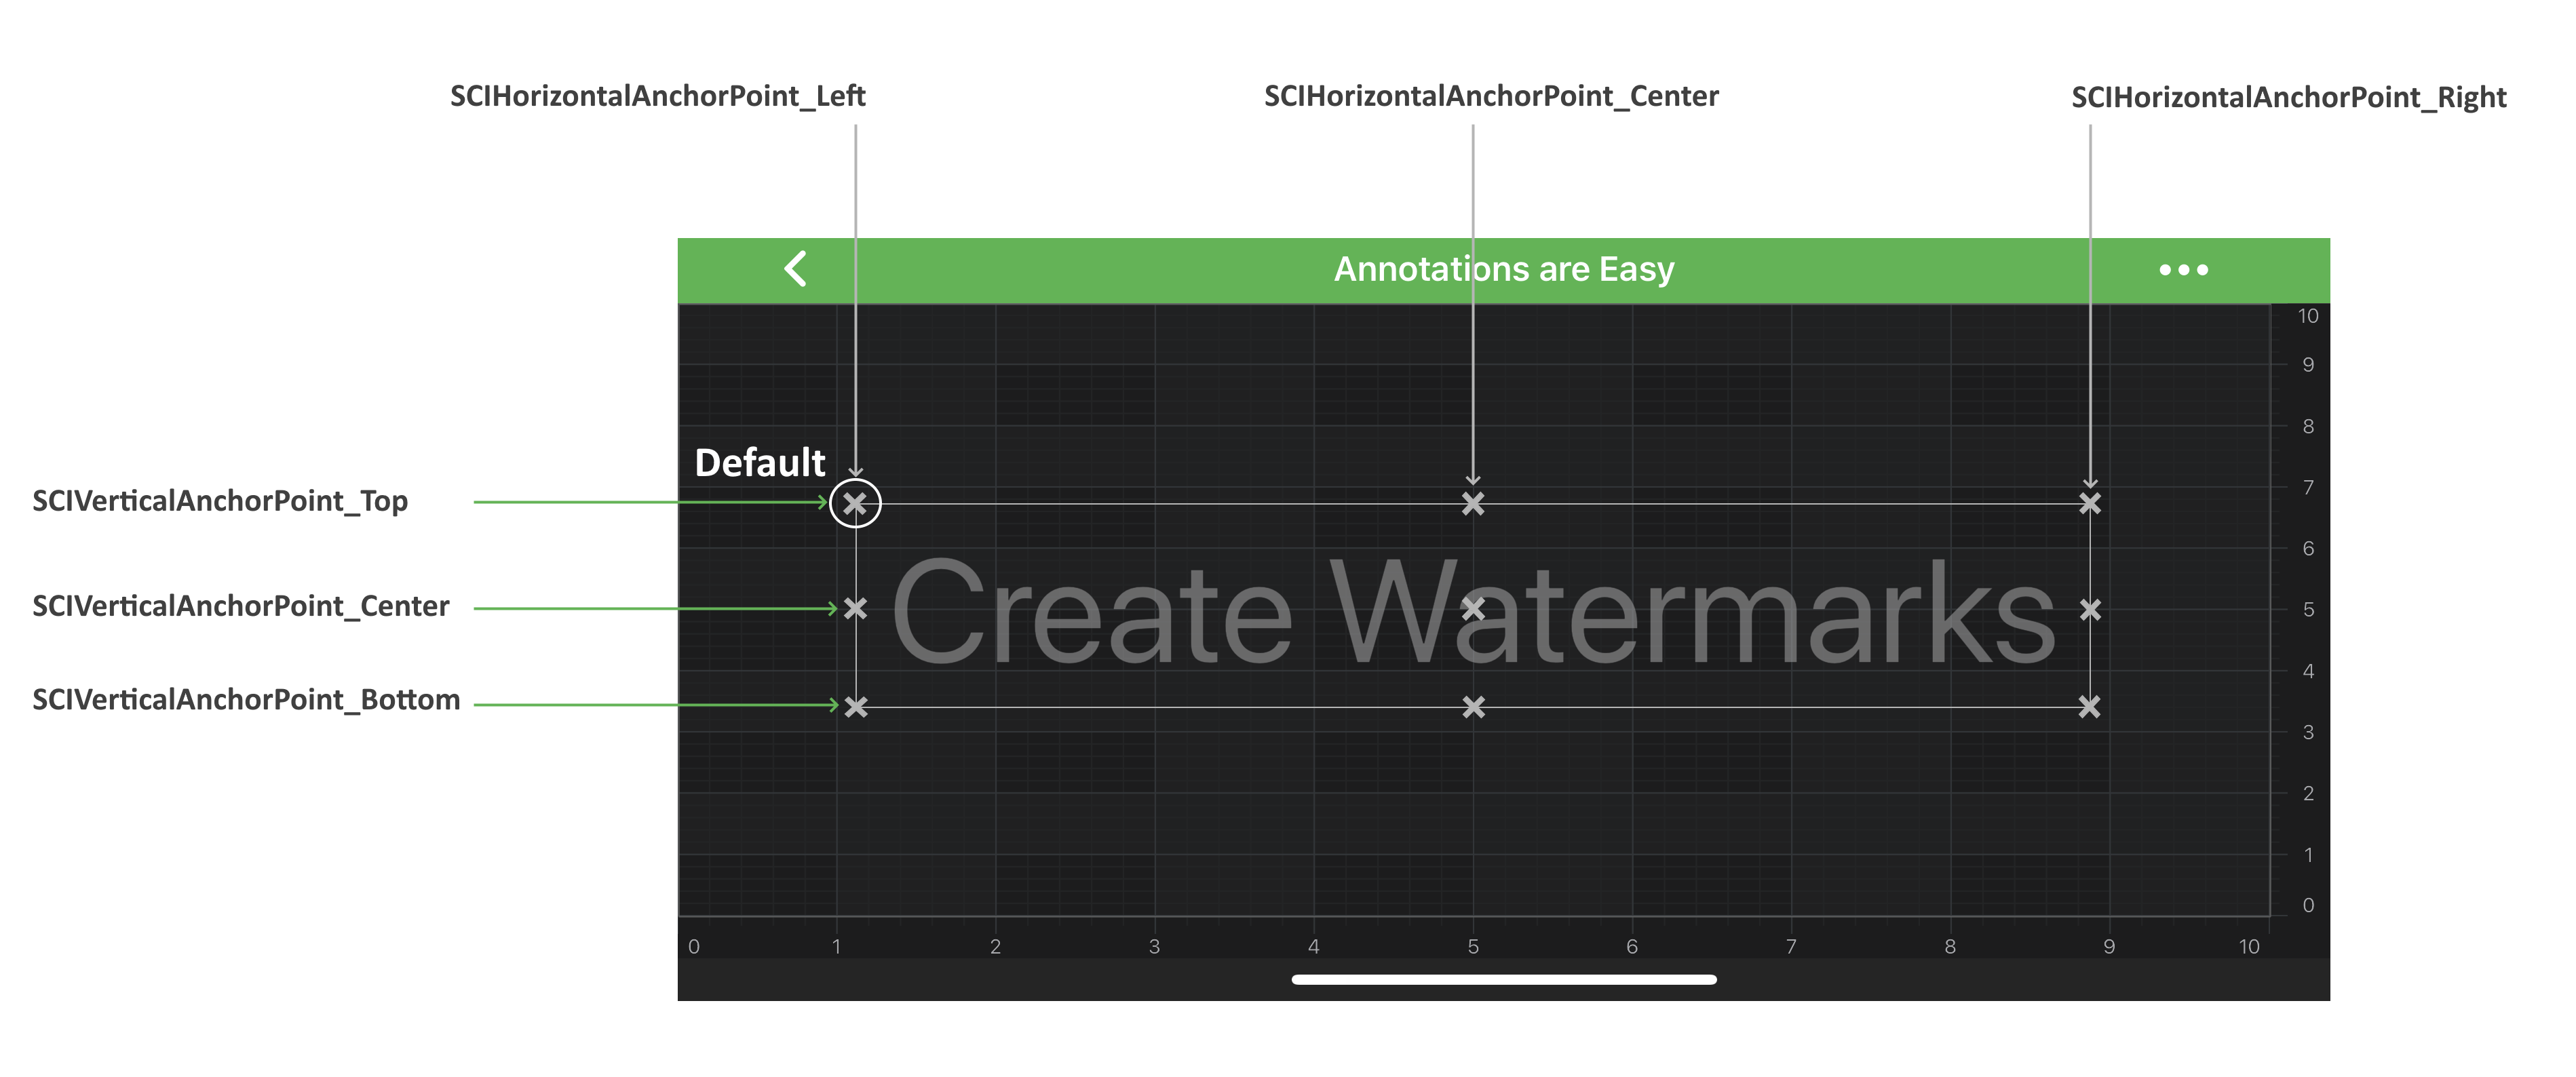
There is the subset of classes among all the annotation types that allows their instances to be aligned relative to the [X1, Y1] control point. The base class responsible for this behavior is called AnchorPointAnnotation. It has two properties, which accepts the HorizontalAnchorPoint and VerticalAnchorPoint enumerations correspondingly:
- setHorizontalAnchorPoint(HorizontalAnchorPoint horizontalAnchorPoint)
- setVerticalAnchorPoint(VerticalAnchorPoint verticalAnchorPoint)
The image below illustrates how those works:
The annotation types that derive from AnchorPointAnnotation are the following:
As the information above implies, annotations of these types are controlled by the [X1, Y1] coordinates only. The [X2, Y2] coordinates have no impact on placement and are simply ignored.
Editing Annotations via User Drag
In SciChart - All Annotation Types are supporting dragging and repositioning via touch. As mentioned above - that's can be controlled via the isEditable.
Note
This is demonstrated in the Interaction with Annotations example which can be found in the SciChart Android Examples Suite as well as on GitHub: