Xamarin Chart - Examples
Please note! These examples are new to SciChart Mobile v3 release! SciChart iOS & Android ship with Xamarin.iOS and Xamarin.Android bindings around our native iOS & Android Chart controls, allowing you to create fast & feature rich charts to your Xamarin applications. We include ~90 native iOS examples and 90 Android examples, but now also ~60 Xamarin Chart Examples to help you get started with SciChart. You can download the source for our Xamarin Chart Examples from Github, or browse the source code below.
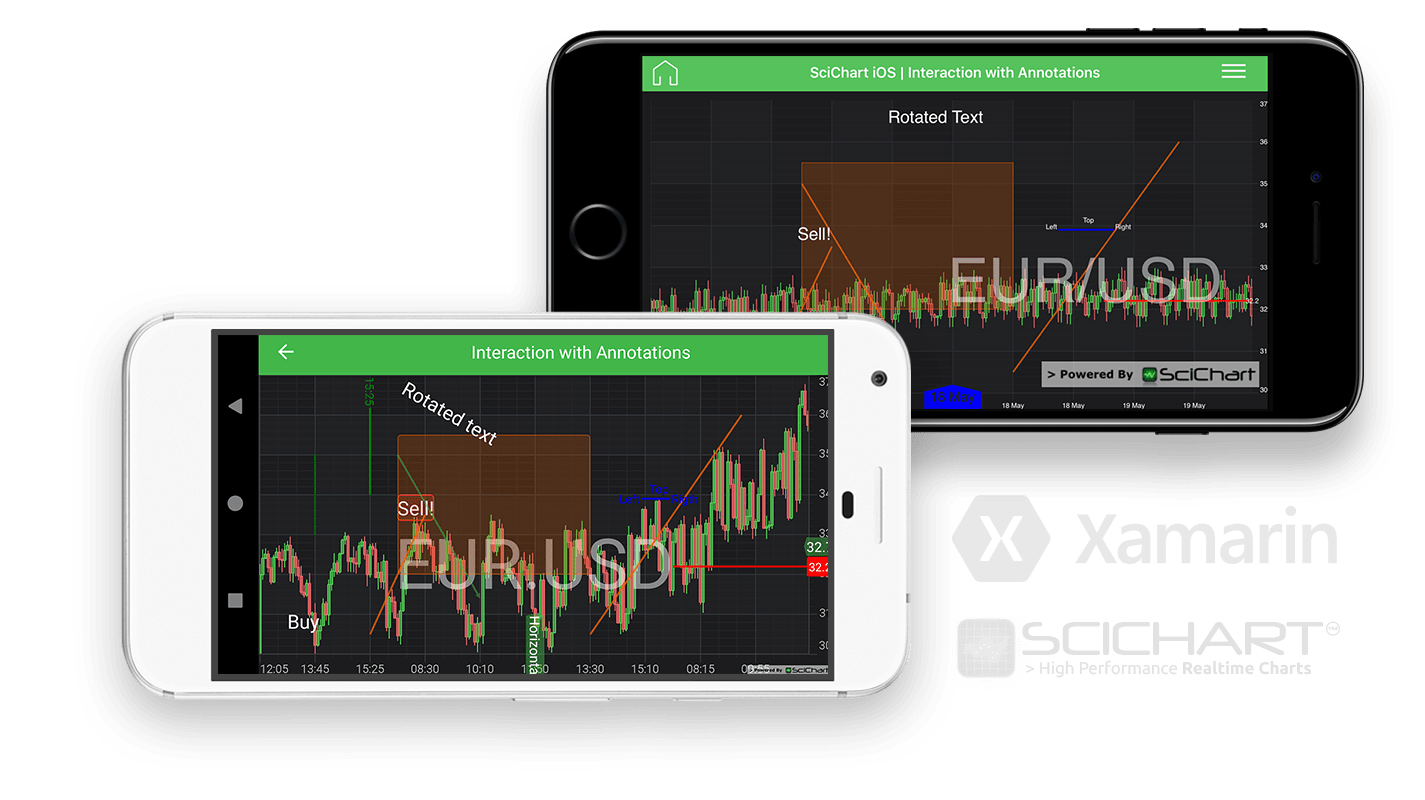
This example demonstrates the SciChart Xamarin iOS Annotations API and Xamarin Android Annotations API, which allows UIView elements to be placed over the Xamarin Chart at specific X and Y data-values.
Annotation Types Include:
- AxisMarkerAnnotation iOS and AxisMarkerAnnotation Android
- BoxAnnotation iOS and BoxAnnotation Android
- CustomAnnotation iOS and CustomAnnotation Android
- HorizontalLineAnnotation iOS and HorizontalLineAnnotation Android
- LineAnnotation iOS and LineAnnotation Android
- LineArrowAnnotation iOS and LineArrowAnnotation Android
- TextAnnotation iOS and TextAnnotation Android
- VerticalLineAnnotation iOS and VerticalLineAnnotation Android
Tip!
You can make annotations Read-only, by calling the setIsEditable(false) on an Annotation. In this example, all the annotations have IsEditable=true. You can select them, drag and resize via the anchor-points.

The C#/Xamarin.iOS/Xamarin.Android source code for the Xamarin Interaction with Annotations example is included below (Scroll down!).
Did you know you can also view the source code from one of the following sources as well?
- Clone the SciChart.Xamarin.Examples from Github.
- Also, the SciChart for Xamarin Trial contains the full source code for the Xamarin chart examples (link below).
InteractionWithAnnotationsViewController.cs (Xamarin.iOS)
View source codeInteractionWithAnnotationsFragment.cs (Xamarin.Android)
View source codeusing System;
using System.Linq;
using Android.Views;
using SciChart.Charting.Model;
using SciChart.Charting.Model.DataSeries;
using SciChart.Charting.Modifiers;
using SciChart.Charting.Visuals;
using SciChart.Charting.Visuals.Annotations;
using SciChart.Charting.Visuals.Axes;
using SciChart.Charting.Visuals.RenderableSeries;
using SciChart.Data.Model;
using SciChart.Drawing.Common;
using Xamarin.Examples.Demo;
using Xamarin.Examples.Demo.Data;
using Xamarin.Examples.Demo.Droid.Extensions;
using Xamarin.Examples.Demo.Droid.Fragments.Base;
using Xamarin.Examples.Demo.Utils;
namespace Xamarin.Examples.Demo.Droid.Fragments.Examples
{
[ExampleDefinition("Interaction with Annotations", description:"Demonstrates Interaction with Annotations via touch", icon: ExampleIcon.Annotations)]
public class InteractionWithAnnotationsFragment : ExampleBaseFragment
{
public override int ExampleLayoutId => Resource.Layout.Example_Single_Chart_Fragment;
private SciChartSurface Surface => View.FindViewById<SciChartSurface>(Resource.Id.chart);
protected override void InitExample()
{
var dataSeries = new OhlcDataSeries<DateTime, double>();
var marketDataService = new MarketDataService(new DateTime(2000, 08, 01, 12, 00, 00), 5, 5);
var data = marketDataService.GetHistoricalData(200);
dataSeries.Append(data.Select(x => x.DateTime), data.Select(x => x.Open), data.Select(x => x.High), data.Select(x => x.Low), data.Select(x => x.Close));
Surface.XAxes.Add(new CategoryDateAxis(Activity));
Surface.YAxes.Add(new NumericAxis(Activity) {VisibleRange = new DoubleRange(30, 37)});
Surface.RenderableSeries.Add(new FastCandlestickRenderableSeries {DataSeries = dataSeries});
Surface.ChartModifiers.Add(new ZoomPanModifier());
Surface.Annotations = new AnnotationCollection
{
new TextAnnotation(Activity)
{
CoordinateMode = AnnotationCoordinateMode.Relative,
HorizontalAnchorPoint = HorizontalAnchorPoint.Center,
Text = "EUR.USD",
FontStyle = new FontStyle(72.ToDip(Activity), 0x77FFFFFF),
X1Value = 0.5,
Y1Value = 0.5
},
new TextAnnotation(Activity)
{
IsEditable = true,
Text = "Buy",
X1Value = 10d,
Y1Value = 30.5d,
VerticalAnchorPoint = VerticalAnchorPoint.Bottom,
FontStyle = new FontStyle(20.ToDip(Activity), ColorUtil.White),
},
new TextAnnotation(Activity)
{
Background = Activity.GetDrawableCompat(Resource.Drawable.example_text_annotation_background),
IsEditable = true,
Text = "Sell!",
X1Value = 50d,
Y1Value = 34d,
FontStyle = new FontStyle(20.ToDip(Activity), ColorUtil.White),
},
new BoxAnnotation(Activity)
{
IsEditable = true,
Background = Activity.GetDrawableCompat(Resource.Drawable.example_box_annotation_background_4),
X1Value = 50,
Y1Value = 35.5,
X2Value = 120,
Y2Value = 32,
},
new LineAnnotation(Activity)
{
IsEditable = true,
Stroke = new SolidPenStyle(0xAAFF6600, 2f.ToDip(Activity)),
X1Value = 40,
Y1Value = 30.5,
X2Value = 60,
Y2Value = 33.5,
},
new LineAnnotation(Activity)
{
IsEditable = true,
Stroke = new SolidPenStyle(0xAAFF6600, 2f.ToDip(Activity)),
X1Value = 120,
Y1Value = 30.5,
X2Value = 175,
Y2Value = 36,
},
new LineArrowAnnotation(Activity)
{
IsEditable = true,
HeadLength = 8,
HeadWidth = 16,
X1Value = 50,
Y1Value = 35,
X2Value = 80,
Y2Value = 31.4,
},
new AxisMarkerAnnotation(Activity)
{
IsEditable = true,
Y1Value = 32.7
},
new AxisMarkerAnnotation(Activity)
{
AnnotationSurface = AnnotationSurfaceEnum.XAxis,
FormattedValue = "Horizontal",
IsEditable = true,
X1Value = 100
},
new HorizontalLineAnnotation(Activity)
{
X1Value = 150,
Y1Value = 32.2,
Stroke = new SolidPenStyle(ColorUtil.Red, 2f.ToDip(Activity)),
HorizontalGravity = GravityFlags.Right,
IsEditable = true,
AnnotationLabels = new AnnotationLabelCollection()
{
new AnnotationLabel(Activity)
{
LabelPlacement = LabelPlacement.Axis
}
}
},
new HorizontalLineAnnotation(Activity)
{
X1Value = 130,
X2Value = 160,
Y1Value = 33.9,
Stroke = new SolidPenStyle(ColorUtil.Blue, 2f.ToDip(Activity)),
HorizontalGravity = GravityFlags.CenterHorizontal,
IsEditable = true,
AnnotationLabels = new AnnotationLabelCollection()
{
new AnnotationLabel(Activity)
{
LabelPlacement = LabelPlacement.Left,
Text = "Left"
},
new AnnotationLabel(Activity)
{
LabelPlacement = LabelPlacement.Top,
Text = "Top"
},
new AnnotationLabel(Activity)
{
LabelPlacement = LabelPlacement.Right,
Text = "Rigth"
}
}
},
new VerticalLineAnnotation(Activity)
{
X1Value = 20,
Y1Value = 35,
Y2Value = 33,
Stroke = new SolidPenStyle(ColorUtil.DarkGreen, 2f.ToDip(Activity)),
VerticalGravity = GravityFlags.CenterVertical,
IsEditable = true
},
new VerticalLineAnnotation(Activity)
{
X1Value = 40,
Y1Value = 34,
Stroke = new SolidPenStyle(ColorUtil.Green, 2f.ToDip(Activity)),
VerticalGravity = GravityFlags.Top,
IsEditable = true,
AnnotationLabels = new AnnotationLabelCollection()
{
new AnnotationLabel(Activity)
{
LabelPlacement = LabelPlacement.Top,
RotationAngle = 90
}
}
},
new TextAnnotation(Activity)
{
X1Value = 50,
Y1Value = 37,
IsEditable = true,
Text = "Rotated text",
FontStyle = new FontStyle(20.ToDip(Activity), ColorUtil.White),
RotationAngle = 30
}
};
}
}
}