Creating a React Drag & Drop Chart Dashboard Performance Demo with 100 Charts
When building real-time data visualization applications, performance is often a critical factor—especially when dealing with large datasets and frequent updates. […]

I often hear other organisations talk about their ‘purpose’, and a part of me is sceptical. I believe that most entrepreneurs’ stories are in reality ‘see a gap, fill it and make some money’ as opposed to worthy world-changing purposes and missions, but in truth, that is what has happened to us. SciChart’s wider purpose materialised as others saw the true potential of what we do, when all that I was originally trying to do was fix a problem I had, and maybe make some money on the way.
I have always set out to make a difference, and wanted to build a product or service which positively benefited the world. It didn’t occur to me that something like a chart library could actually be as successful or beneficial as it is.
After initially starting SciChart as a ‘bedroom business’ without any capital and coding the first versions on the commute to work, we now serve over 10,000 customers in 90 countries. We’ve been a part of ground-breaking innovations and are active participants in charitable causes, consistently donating around 10% of our profits to charities.
Our journey has been a process of discovery and growth, and now we are thrilled to unveil our updated positioning and brand new online presence. I would like to take a moment to reflect on the journey behind SciChart and share it with you.
SciChart was founded over a decade ago but research dating back to 2003 led to the development of our GPU-accelerated 2D/3D chart library. While carrying out a PhD at the University of Manchester, I saw a need to plot large datasets in 2D & 3D. My PhD title A 3D Acoustic Local Positioning System to track a Neutrally Bouyant Flow Follower focussed on developing novel algorithms, software & hardware to accurately position a small device, in an enclosed underwater environment using ultrasound.
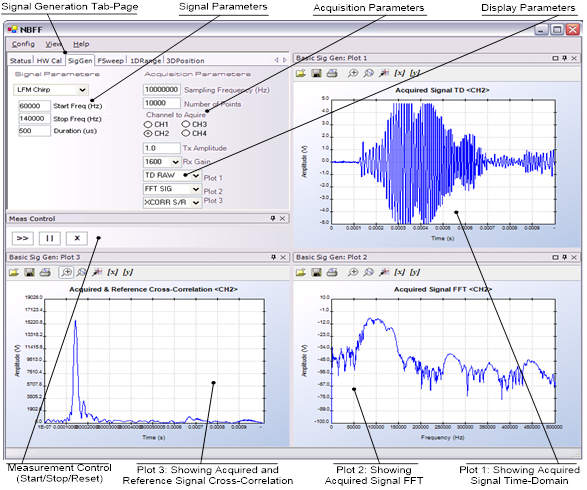
Utilising Signal Processing and similar techniques to GPS, and having designed built all the hardware and software required to do this, I found that I was missing quite an instrumental part – the charts needed to plot big datasets and 3D visualisation to verify the result. Data acquisition hardware was outputting 1 million data points in each capture, and, at the time, there were no available commercial chart libraries that could handle this, and so in my spare time I wrote my own solution.
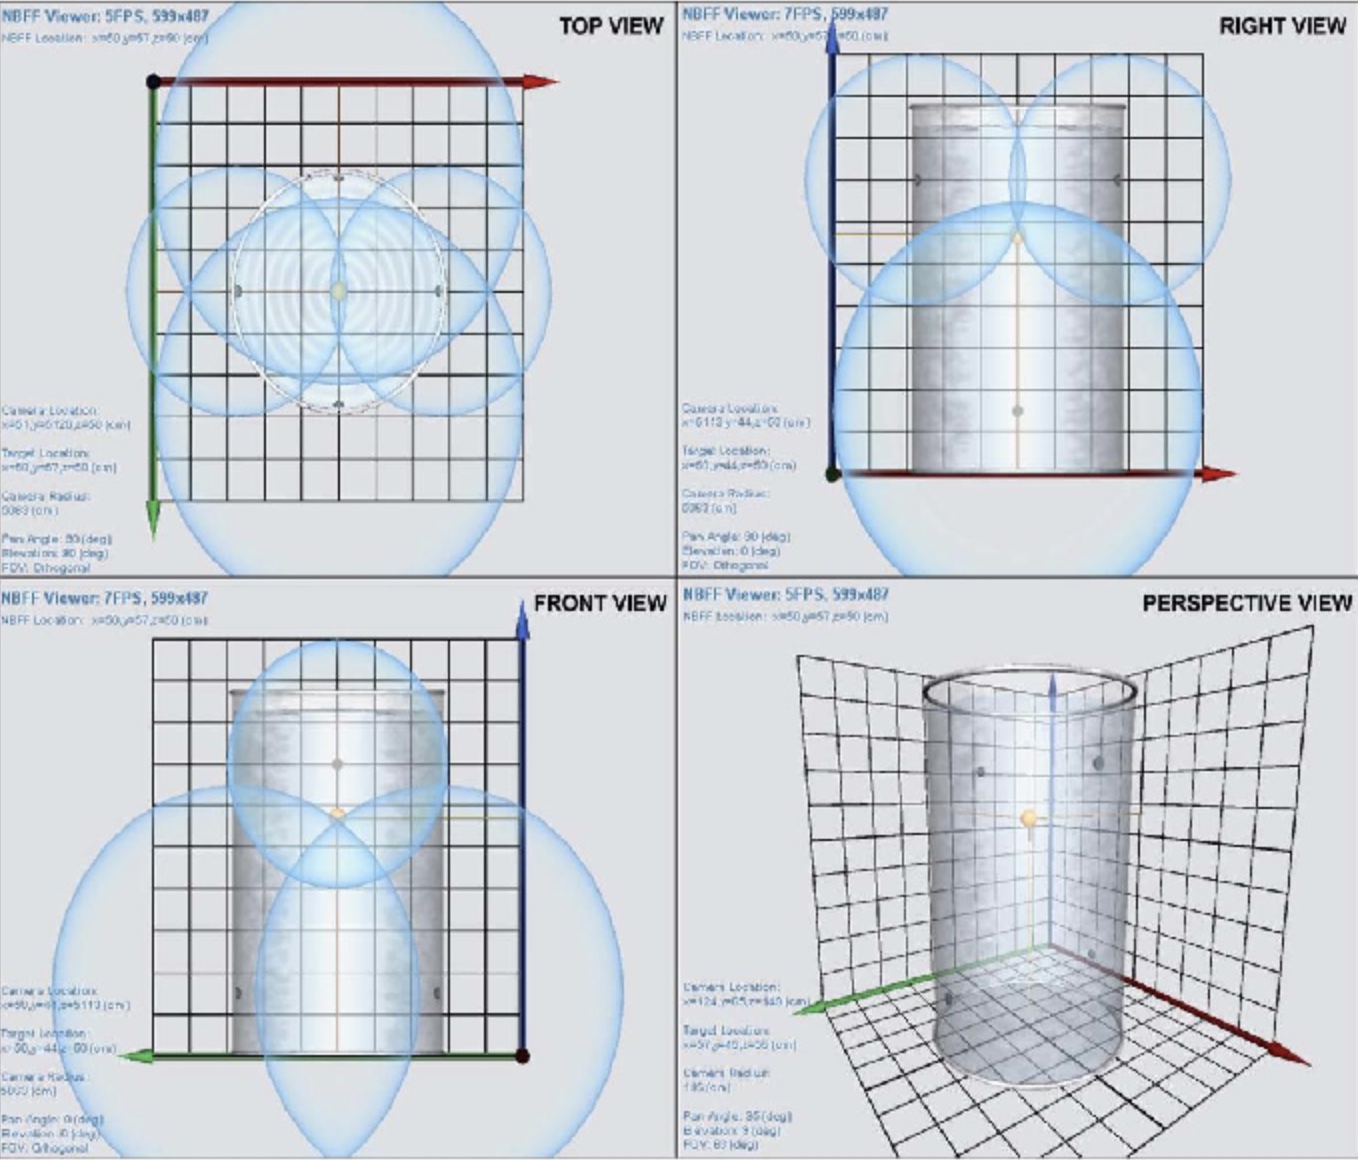 Top, Right, Side and Perspective View showing 3D position of sensors
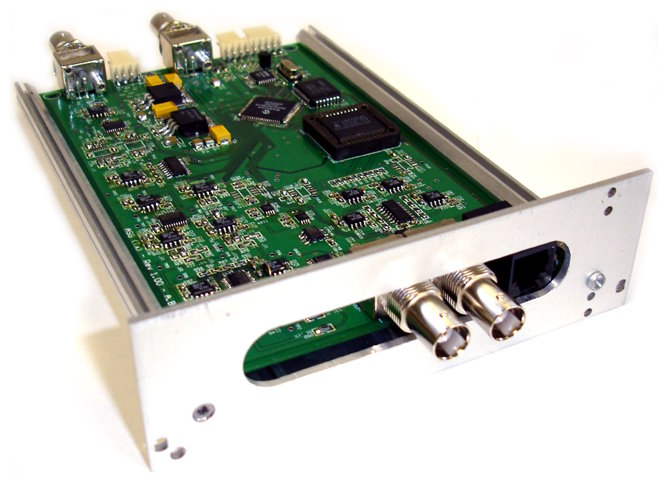 Hardware which I designed for signal generation and acquisition
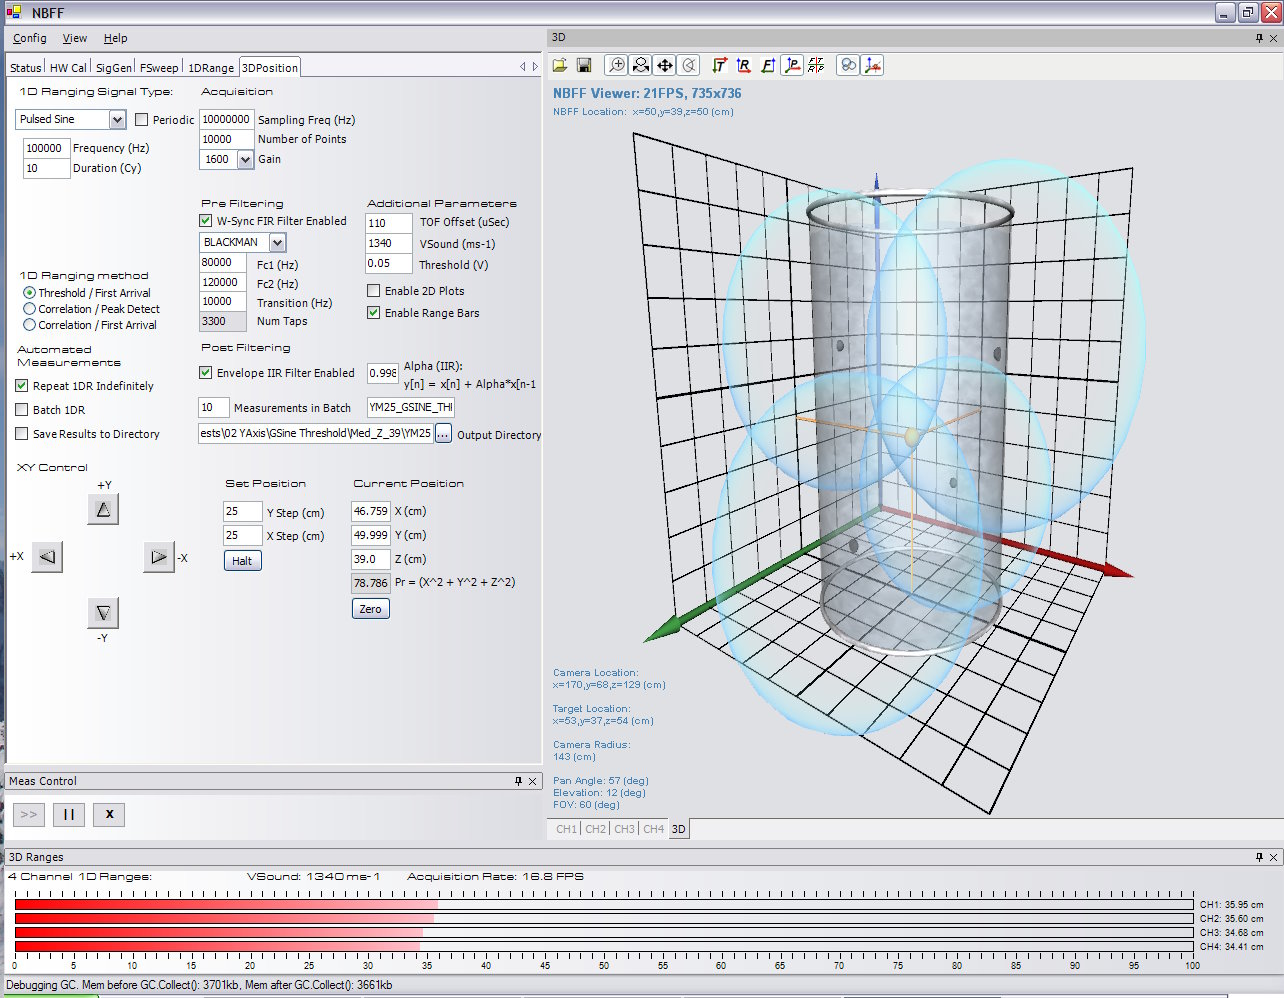 Software to visually debug 3D positioning experiments
Later after working as a software engineer for scientific firms such as Unilever, Shell, Shimadzu as well as Investment Banks such as Bank of America, RBS, Barclays I saw a similar need in the marketplace. To my surprise by this time there were still no commercially available solutions which could chart more than 10-20,000 datapoints.
A sense of urgency to create a high performance chart library as a commercial offering led to me beginning work in my spare time and on the commuter train to work. The first problem to solve was mixing Raster (bitmap) rendering with Vector graphics in WPF. I started blogging about what I was doing, sharing some demos of the early versions of SciChart WPF. This drew the attention of companies, in particular in the medical sciences sector, that required high performance data visualisation. They soon contacted me to find out when they could expect to purchase their licences for this software. This was unexpected, but welcome. With the help of a graphic designer, I built a website with integrated e-commerce, and the first version went live in March 2012. Within a few weeks, I had my very first customer!
I still remember how it felt to get the notification that someone I’ve never met spent almost $2,000 on a website I’d just created. Our first customer remains to this day – a testament to the loyalty of our users to SciChart, who rate us very highly.
I re-invested all the early profits from SciChart into staff & hiring and personally didn’t take a salary for three years, continuing to work full-time and develop the software in evenings and weekends. Until today SciChart remains a privately owned, profitable, independent business with around 20 staff which was started on a dream.
But that’s not all, a huge surprise to me has been how our software has made a difference in the projects where it’s employed, being pivotal behind ground-breaking innovations which have positively impacted the world…
Over the years the the rapid growth of customers, both paid-for and free, meant we were having more and more conversations with those who needed to push the boundaries of what was possible and it became increasingly clear that SciChart was making a difference in the world.
The user case-studies that really stand out to me over the years include:
All three of these examples were a result of free academic licenses gifted by SciChart. Over the years we’ve donated software for free to over almost 300 universities including MIT, Stanford, Imperial College London and more. We’re immensely proud to be a part of making a difference and advancing science & technology in this way.
I’ve talked to many commercial application developers who were using SciChart to improve neonatal care, for use in developing renewables, improving the lives of those with diabetes, particle physics, and those exploring space. Some of our customers have won awards and there are numerous examples of customers winning funding for their innovative applications.
It became increasingly evident to me that SciChart is a transformational product that has not only changed my own life, but as customers quickly began to deploy SciChart in their worlds, is now changing the lives of others.
Purpose is now hard-wired into what we do, and it sits at the centre of much of our decision-making. This year we’ll be doubling down with some exciting product developments as you’d expect, but also by making our software even more accessible for those making a difference, and launching new incentives to reward and recognise them.
If you are a customer exploring new areas of research please contact me and let me know what you are doing. Your stories are what helps us stay focussed on gloomy January days and the world seems a less caring place. They matter to us.
To explore more about our journey, go have a look at our website.
Our focus is on those who are pushing the boundaries of what was previously possible, to help you to see further, see faster and see without compromise. 2023 will be a big leap forward in that mission and I look forward to sharing the astonishing stories of what our customers have achieved and what is made possible with SciChart.
Recent Blogs
![]()
Queens Award for Innovation
Proud winners of the Queens Award for Innovation, 2019. Awarded on account of our innovative graphics engine which underpins the SciChart library and enables our world-beating charting performance
![]()
National Business Awards
Highly Commended for Lloyds National Business Awards, 2019. Awarded on account of our innovative graphics engine and impressive customer base
![]()
National Technology Awards
Awarded “Healthcare Tech of the Year” at the 2025 National Technology Awards – a top UK recognition for breakthrough innovation in technology.

Reviews
SciChart has received hundreds of verified, 3rd party reviews