Create Impressive WPF 3D Charts with the Fastest Chart Library
The World’s Best WPF 3D Charts keep getting better!
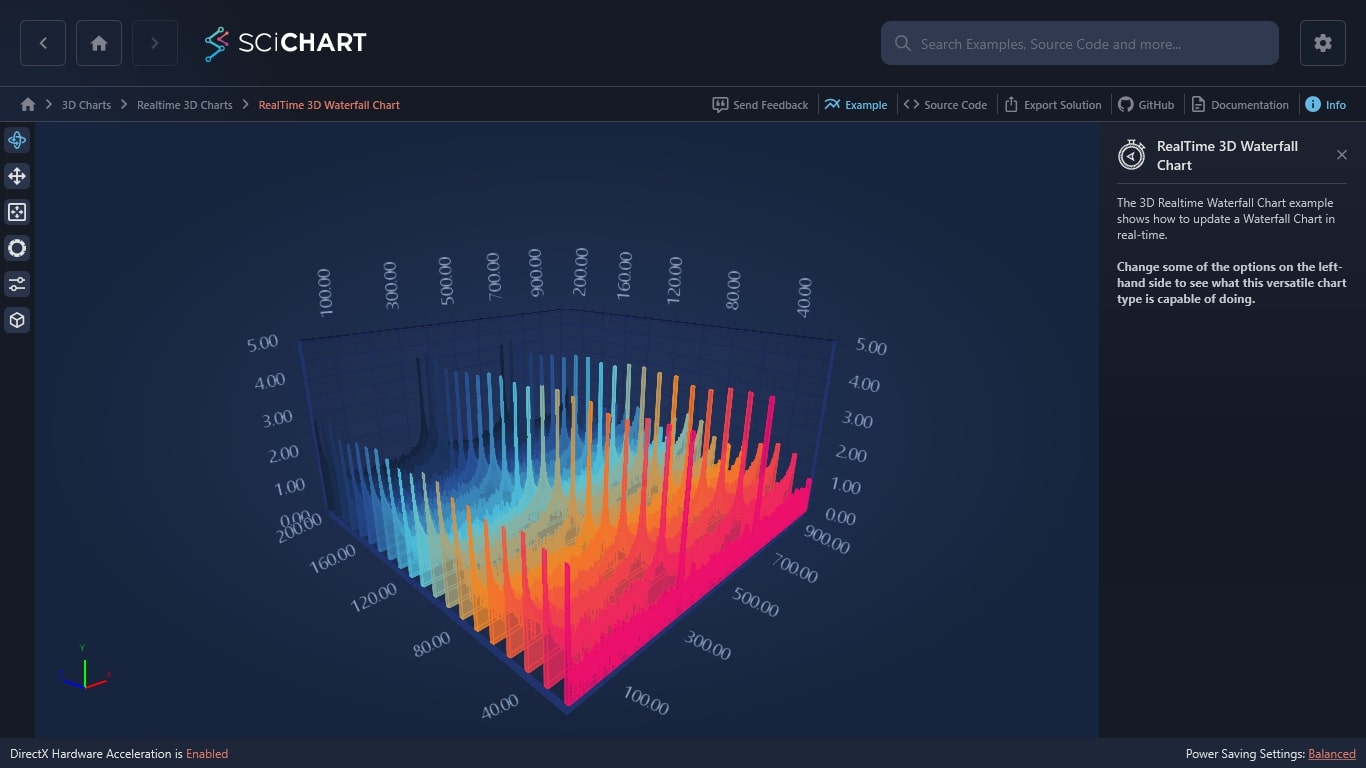
SciChart 3D for WPF is a real-time, high-performance, WPF 3D Chart Library made with financial, medical, scientific apps in mind. Perfect for projects that need extreme performance and rich, interactive 3D charts.
Get the job done with our DirectX-powered WPF 3D Charts and extensive API.
With the option to get a free 30-day trial, you can see for yourself the difference SciChart makes to your WPF 3D Charts.