WPF Chart - Examples
SciChart WPF ships with hundreds of WPF Chart Examples which you can browse, play with, view the source-code and even export each WPF Chart Example to a stand-alone Visual Studio solution. All of this is possible with the new and improved SciChart WPF Examples Suite, which ships as part of the SciChart WPF SDK.
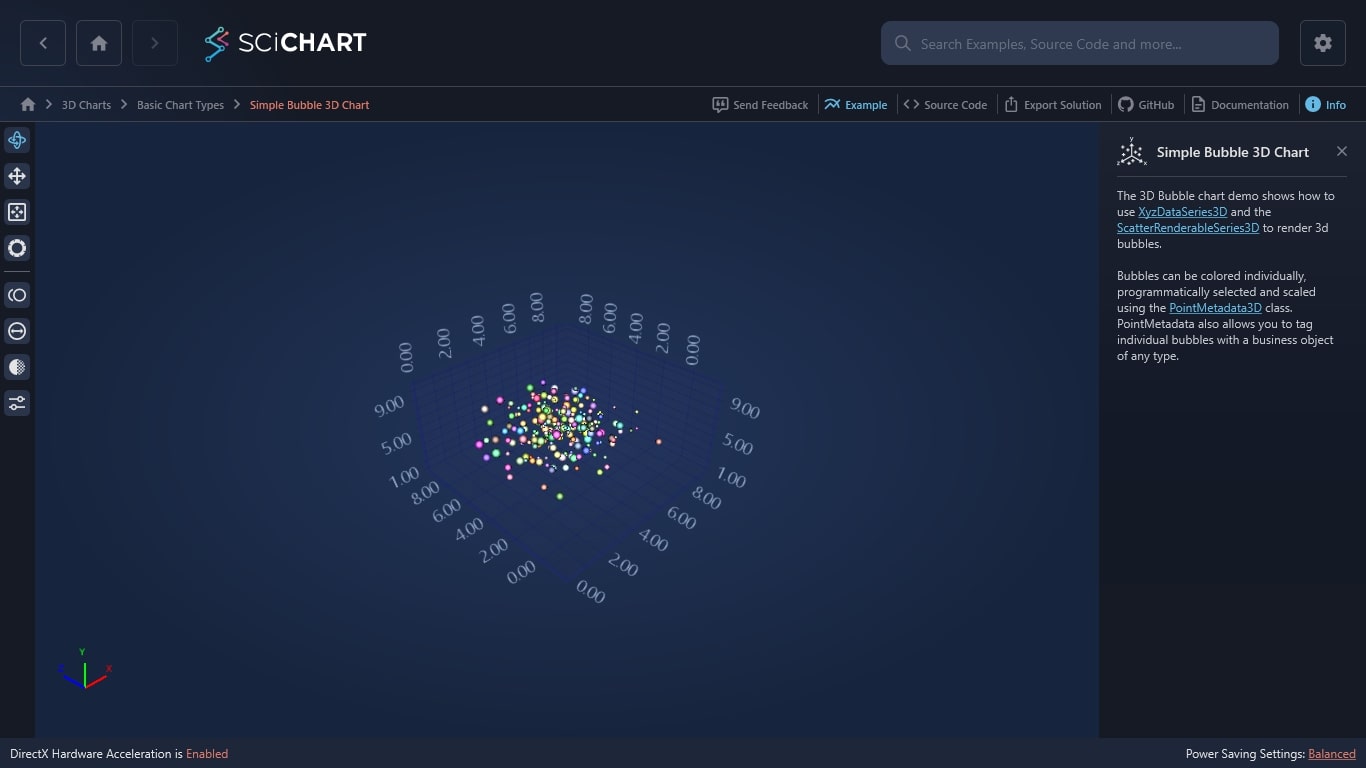
SciChart’s WPF 3D chart library and 3D Bubble chart demo shows how to use XyzDataSeries3D and the ScatterRenderableSeries3D to render 3d bubbles.
Bubbles can be colored individually, programmatically selected and scaled using the PointMetadata3D class. PointMetadata also allows you to tag individual bubbles with a business object of any type.

The C#/WPF source code for the WPF 3D Bubble Chart Example example is included below (Scroll down!).
Did you know you can also view the source code from one of the following sources as well?
- Clone the SciChart.WPF.Examples from Github.
- Or, view source in the SciChart WPF Examples suite.
- Also the SciChart WPF Trial contains the full source for the examples (link below).
CreateABubble3DChart.xaml
View source code<UserControl x:Class="SciChart.Examples.Examples.Charts3D.CreateA3DChart.CreateABubble3DChart"
xmlns="http://schemas.microsoft.com/winfx/2006/xaml/presentation"
xmlns:x="http://schemas.microsoft.com/winfx/2006/xaml"
xmlns:d="http://schemas.microsoft.com/expression/blend/2008"
xmlns:ext="http://schemas.abtsoftware.co.uk/scichart/exampleExternals"
xmlns:mc="http://schemas.openxmlformats.org/markup-compatibility/2006"
xmlns:s3D="http://schemas.abtsoftware.co.uk/scichart3D"
d:DesignHeight="400"
d:DesignWidth="600"
mc:Ignorable="d">
<Grid>
<Grid.Resources>
<ext:LinearToLogarithmicValueConverter x:Key="LinearToLogarithmicValueConverter"/>
</Grid.Resources>
<Grid.ColumnDefinitions>
<ColumnDefinition Width="Auto" />
<ColumnDefinition Width="*" />
</Grid.ColumnDefinitions>
<!-- The SciChart3DInteractionToolbar adds rotate, orbit, zoom, pan, zoom extents functionality -->
<!-- to the chart and is included for example purposes. -->
<!-- If you wish to know how to zoom and pan a 3D chart then do a search for Zoom Pan in the Examples suite! -->
<ext:SciChart3DInteractionToolbar TargetSurface="{Binding Source={x:Reference Name=SciChart}}">
<ext:FlyoutSeparator Background="#444" />
<ext:FlyoutMenuButton Content="PM"
Padding="0"
Style="{StaticResource FlyoutMenuButtonStyle}">
<ext:FlyoutMenuButton.PopupContent>
<StackPanel MinWidth="150" Orientation="Vertical">
<TextBlock Text="PointMarker3D Type" />
<ext:FlyoutSeparator />
<ComboBox x:Name="PointMarkerCombo"
SelectedIndex="0"
DisplayMemberPath="Name"
SelectionChanged="PointMarkerCombo_OnSelectionChanged">
</ComboBox>
</StackPanel>
</ext:FlyoutMenuButton.PopupContent>
</ext:FlyoutMenuButton>
<ext:FlyoutMenuButton Content="SIZE"
Padding="0"
Style="{StaticResource FlyoutMenuButtonStyle}">
<ext:FlyoutMenuButton.PopupContent>
<StackPanel MinWidth="150" Orientation="Vertical">
<TextBlock Text="Slide to change PointMarker Size" />
<ext:FlyoutSeparator />
<!-- Create the size slider -->
<Slider x:Name="SizeSlider"
Margin="4"
HorizontalAlignment="Stretch"
Maximum="3.0"
Minimum="0.1"
Orientation="Horizontal"
ValueChanged="SizeSlider_OnValueChanged"
Value="2.0" />
</StackPanel>
</ext:FlyoutMenuButton.PopupContent>
</ext:FlyoutMenuButton>
<ext:FlyoutMenuButton Content="OP"
Padding="0"
Style="{StaticResource FlyoutMenuButtonStyle}">
<ext:FlyoutMenuButton.PopupContent>
<StackPanel MinWidth="150" Orientation="Vertical">
<TextBlock Text="Slide to change PointMarker Opacity" />
<ext:FlyoutSeparator />
<!-- Create the opacity slider -->
<Slider x:Name="OpacitySlider"
Margin="4"
HorizontalAlignment="Stretch"
Maximum="1.0"
Minimum="0.1"
Orientation="Horizontal"
ValueChanged="OpacitySlider_OnValueChanged"
Value="1.0" />
</StackPanel>
</ext:FlyoutMenuButton.PopupContent>
</ext:FlyoutMenuButton>
<ext:FlyoutMenuButton Style="{StaticResource FlyoutMenuButtonStyle}"
Content="MTRL"
FontSize="10"
Padding="0">
<ext:FlyoutMenuButton.PopupContent>
<StackPanel Orientation="Vertical" MinWidth="150">
<TextBlock FontSize="12" Text="Shininess" />
<Slider Minimum="0" Maximum="11" x:Name="shininessSlider" Margin="4" Orientation="Horizontal" HorizontalAlignment="Stretch"/>
<TextBlock FontSize="12" Text="Specular Strength" />
<Slider Minimum="0.1" Maximum="5.0" x:Name="specularStrengthSlider" Value="1.0" Margin="4" Orientation="Horizontal" HorizontalAlignment="Stretch"/>
</StackPanel>
</ext:FlyoutMenuButton.PopupContent>
</ext:FlyoutMenuButton>
</ext:SciChart3DInteractionToolbar>
<s3D:SciChart3DSurface x:Name="SciChart"
Grid.Column="1"
BorderThickness="0"
WorldDimensions="200,100,200">
<s3D:SciChart3DSurface.Camera>
<s3D:Camera3D ZoomToFitOnAttach="True" />
</s3D:SciChart3DSurface.Camera>
<s3D:SciChart3DSurface.RenderableSeries>
<!-- To create a Scatter Chart, create a ScatterRenderableSeries3D and use a 3D point marker type -->
<s3D:ScatterRenderableSeries3D x:Name="ScatterSeries3D"
SpecularStrength="{Binding Source={x:Reference Name=specularStrengthSlider}, Path=Value, Mode=TwoWay}"
Shininess="{Binding Source={x:Reference Name=shininessSlider}, Path=Value, Converter={StaticResource LinearToLogarithmicValueConverter}}">
<s3D:ScatterRenderableSeries3D.PointMarker>
<s3D:EllipsePointMarker3D Fill="LimeGreen" Size="2.0" Opacity="1"/>
</s3D:ScatterRenderableSeries3D.PointMarker>
</s3D:ScatterRenderableSeries3D>
</s3D:SciChart3DSurface.RenderableSeries>
<s3D:SciChart3DSurface.XAxis>
<s3D:NumericAxis3D GrowBy="0.1, 0.1" />
</s3D:SciChart3DSurface.XAxis>
<s3D:SciChart3DSurface.YAxis>
<s3D:NumericAxis3D GrowBy="0.1, 0.1" />
</s3D:SciChart3DSurface.YAxis>
<s3D:SciChart3DSurface.ZAxis>
<s3D:NumericAxis3D GrowBy="0.1, 0.1" />
</s3D:SciChart3DSurface.ZAxis>
<s3D:SciChart3DSurface.ChartModifier>
<s3D:XyzGizmoModifier3D />
</s3D:SciChart3DSurface.ChartModifier>
</s3D:SciChart3DSurface>
</Grid>
</UserControl>CreateABubble3DChart.xaml.cs
View source code// *************************************************************************************
// SCICHART® Copyright SciChart Ltd. 2011-2022. All rights reserved.
//
// Web: http://www.scichart.com
// Support: support@scichart.com
// Sales: sales@scichart.com
//
// CreateABubble3DChart.xaml.cs is part of the SCICHART® Examples. Permission is hereby granted
// to modify, create derivative works, distribute and publish any part of this source
// code whether for commercial, private or personal use.
//
// The SCICHART® examples are distributed in the hope that they will be useful, but
// without any warranty. It is provided "AS IS" without warranty of any kind, either
// expressed or implied.
// *************************************************************************************
using System;
using System.Windows;
using System.Windows.Controls;
using System.Windows.Media;
using SciChart.Charting3D.Model;
using SciChart.Charting3D.PointMarkers;
using SciChart.Examples.ExternalDependencies.Data;
namespace SciChart.Examples.Examples.Charts3D.CreateA3DChart
{
public partial class CreateABubble3DChart : UserControl
{
public CreateABubble3DChart()
{
InitializeComponent();
PointMarkerCombo.Items.Add(typeof(SpherePointMarker3D));
PointMarkerCombo.Items.Add(typeof(CubePointMarker3D));
PointMarkerCombo.Items.Add(typeof(PyramidPointMarker3D));
PointMarkerCombo.Items.Add(typeof(CylinderPointMarker3D));
Loaded += OnLoaded;
}
private void OnLoaded(object sender, RoutedEventArgs routedEventArgs)
{
var xyzDataSeries3D = new XyzDataSeries3D<double>() {SeriesName = "Colorful Bubble!"};
const int count = 250;
var random = new Random(0);
DataManager.Instance.SetRandomSeed(0); // required only by some UIAutomationTests, to have consistent results between test runs
for (var i = 0; i < count; i++)
{
var x = DataManager.Instance.GetGaussianRandomNumber(5, 1.5);
var y = DataManager.Instance.GetGaussianRandomNumber(5, 1.5);
var z = DataManager.Instance.GetGaussianRandomNumber(5, 1.5);
// Scale is a multiplier used to increase/decrease ScatterRenderableSeries3D.ScatterPointSize
var scale = (float) ((random.NextDouble() + 0.5)*3.0);
// Color is applied to PointMetadata3D and overrides the default ScatterRenderableSeries.Stroke property
Color? randomColor = Color.FromArgb(0xFF, (byte) random.Next(50, 255), (byte) random.Next(50, 255), (byte) random.Next(50, 255));
// To declare scale and colour, add a VertextData class as the w (fourth) parameter.
// The PointMetadata3D class also has other properties defining the behaviour of the XYZ point
xyzDataSeries3D.Append(x, y, z, new PointMetadata3D(randomColor, scale));
}
ScatterSeries3D.DataSeries = xyzDataSeries3D;
PointMarkerCombo.SelectedIndex = 0;
}
private void PointMarkerCombo_OnSelectionChanged(object sender, SelectionChangedEventArgs e)
{
if (ScatterSeries3D != null && OpacitySlider != null && SizeSlider != null)
{
ScatterSeries3D.PointMarker = (BasePointMarker3D) Activator.CreateInstance((Type) ((ComboBox) sender).SelectedItem);
ScatterSeries3D.PointMarker.Size = (float) SizeSlider.Value;
ScatterSeries3D.PointMarker.Opacity = OpacitySlider.Value;
}
}
private void SizeSlider_OnValueChanged(object sender, RoutedPropertyChangedEventArgs<double> e)
{
if (ScatterSeries3D != null && ScatterSeries3D.PointMarker != null)
ScatterSeries3D.PointMarker.Size = (float) ((Slider) sender).Value;
}
private void OpacitySlider_OnValueChanged(object sender, RoutedPropertyChangedEventArgs<double> e)
{
if (ScatterSeries3D != null && ScatterSeries3D.PointMarker != null)
ScatterSeries3D.PointMarker.Opacity = ((Slider) sender).Value;
}
}
}