WPF Chart - Examples
SciChart WPF ships with hundreds of WPF Chart Examples which you can browse, play with, view the source-code and even export each WPF Chart Example to a stand-alone Visual Studio solution. All of this is possible with the new and improved SciChart WPF Examples Suite, which ships as part of the SciChart WPF SDK.
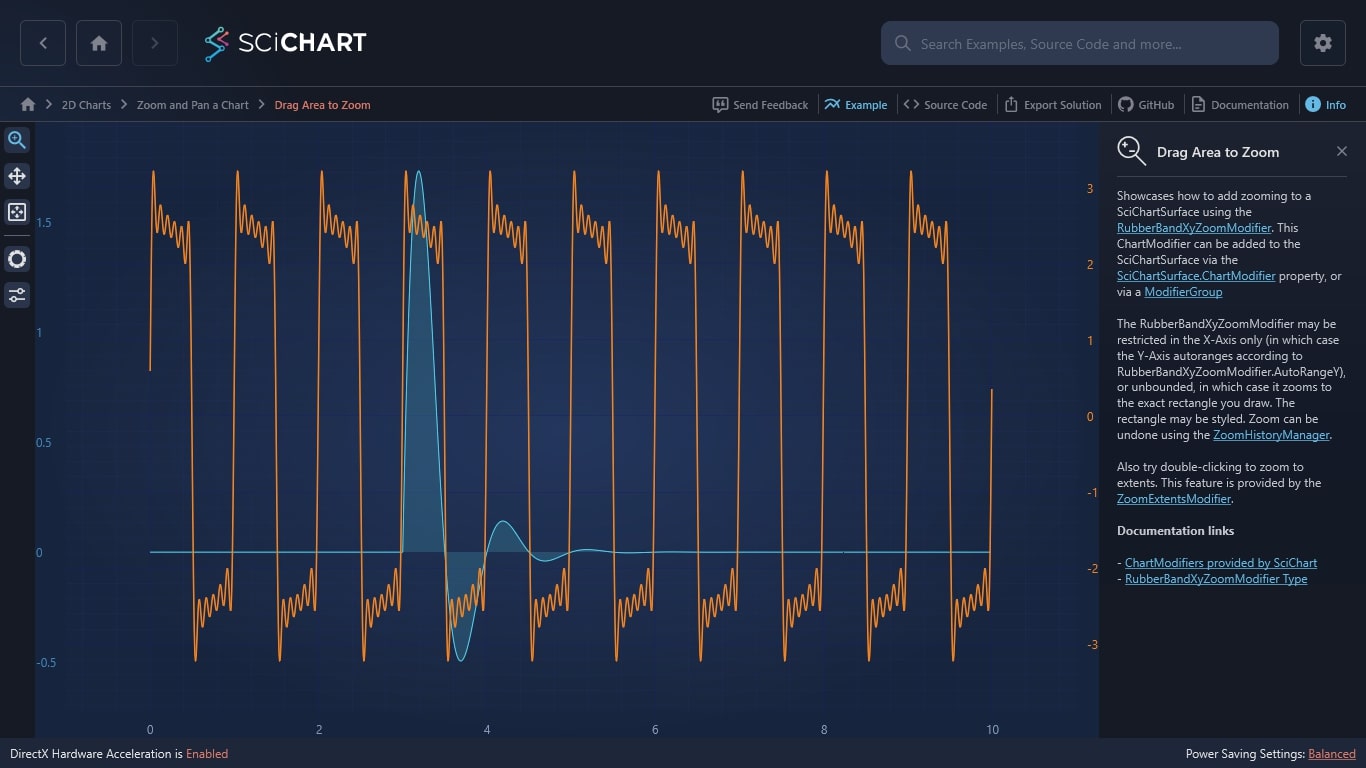
Showcases how to add zooming to a SciChartSurface using the RubberBandXyZoomModifier. This ChartModifier can be added to the SciChartSurface via the SciChartSurface.ChartModifier property, or via a ModifierGroup
The RubberBandXyZoomModifier may be restricted in the X-Axis only (in which case the Y-Axis autoranges according to RubberBandXyZoomModifier.AutoRangeY), or unbounded, in which case it zooms to the exact rectangle you draw. The rectangle may be styled. Zoom can be undone using the ZoomHistoryManager.
Also try double-clicking to zoom to extents. This feature is provided by the ZoomExtentsModifier.
Documentation links
– ChartModifiers provided by SciChart
– RubberBandXyZoomModifier Type

The C#/WPF source code for the WPF Chart Drag Area to Zoom example is included below (Scroll down!).
Did you know you can also view the source code from one of the following sources as well?
- Clone the SciChart.WPF.Examples from Github.
- Or, view source in the SciChart WPF Examples suite.
- Also the SciChart WPF Trial contains the full source for the examples (link below).
DragAreaToZoom.xaml
View source code<UserControl x:Class="SciChart.Examples.Examples.ZoomAndPanAChart.DragAreaToZoom"
xmlns="http://schemas.microsoft.com/winfx/2006/xaml/presentation"
xmlns:x="http://schemas.microsoft.com/winfx/2006/xaml"
xmlns:s="http://schemas.abtsoftware.co.uk/scichart"
xmlns:ext="http://schemas.abtsoftware.co.uk/scichart/exampleExternals"
Loaded="DragAreaToZoom_Loaded"
xmlns:mc="http://schemas.openxmlformats.org/markup-compatibility/2006"
xmlns:d="http://schemas.microsoft.com/expression/blend/2008"
d:DesignHeight="400"
d:DesignWidth="600"
mc:Ignorable="d">
<Grid>
<Grid.ColumnDefinitions>
<ColumnDefinition Width="Auto" />
<ColumnDefinition Width="*" />
</Grid.ColumnDefinitions>
<ext:SciChartInteractionToolbar TargetSurface="{Binding Source={x:Reference Name=sciChart}}">
<ext:FlyoutMenuButton Style="{StaticResource FlyoutMenuButtonStyle}" Content="CTRL" Padding="0">
<ext:FlyoutMenuButton.PopupContent>
<StackPanel Orientation="Vertical" MinWidth="150">
<TextBlock Text="When Dragging to Zoom" />
<ext:FlyoutSeparator/>
<CheckBox x:Name="zoomXAxisOnly" Margin="4" Content="Zoom X-Axis Only" ToolTipService.ToolTip="When checked, the zoom reticule expands vertically, and a zoom on the X-Axis is performed"/>
<CheckBox x:Name="zoomExtentsY" Margin="4" Content="Zoom Extents Y-Axis" ToolTipService.ToolTip="Used in conjunction with Zoom X-Axis Only, when checked performs a Zoom to extents in the Y-direction on zoom, else leaves Y-direction unchanged"/>
<CheckBox x:Name="useAnimation" Margin="4" Content="Use Animation" IsChecked="True" ToolTipService.ToolTip="When checked, zoom operations are performed using animation. Disabling this feature performs an instant zoom to the new visible ranges"/>
</StackPanel>
</ext:FlyoutMenuButton.PopupContent>
</ext:FlyoutMenuButton>
</ext:SciChartInteractionToolbar>
<s:SciChartSurface x:Name="sciChart"
Grid.Column="1">
<s:SciChartSurface.RenderableSeries>
<s:FastMountainRenderableSeries x:Name="mountainSeries"
Fill="#771964FF"
Stroke="#FF0944CF"
YAxisId="SecondaryAxis">
<s:FastMountainRenderableSeries.SeriesAnimation>
<s:SweepAnimation AnimationDelay="0:0:1" Duration="0:0:3"/>
</s:FastMountainRenderableSeries.SeriesAnimation>
</s:FastMountainRenderableSeries>
<s:FastLineRenderableSeries x:Name ="lineSeries"
Stroke="#FF279B27"
StrokeThickness="2"
YAxisId="PrimaryAxis">
<s:FastLineRenderableSeries.SeriesAnimation>
<s:SweepAnimation AnimationDelay="0:0:1" Duration="0:0:3"/>
</s:FastLineRenderableSeries.SeriesAnimation>
</s:FastLineRenderableSeries>
</s:SciChartSurface.RenderableSeries>
<s:SciChartSurface.XAxis>
<s:NumericAxis GrowBy="0.1, 0.1"/>
</s:SciChartSurface.XAxis>
<!-- Create Y Axes on the Left and Right -->
<s:SciChartSurface.YAxes>
<s:NumericAxis AxisAlignment="Right"
Id="PrimaryAxis"
TickTextBrush="#FF279B27"
GrowBy="0.1, 0.1"/>
<s:NumericAxis AxisAlignment="Left"
Id="SecondaryAxis"
TickTextBrush="#FF4083B7"
GrowBy="0.1, 0.1"/>
</s:SciChartSurface.YAxes>
<s:SciChartSurface.ChartModifier>
<s:ModifierGroup>
<!-- Adding the RubberBandXyZoomModifier gives SciChart the ability to zoom on mouse-drag -->
<!-- Note IsEnabled, IsXAxisOnly, ZoomExtentsY and IsAnimated properties are ound to controls in the example -->
<!-- Note default styling is provided by the themes, but you can override RubberBandFill, RubberBandStroke, RubberBandStrokeDashArray -->
<s:RubberBandXyZoomModifier IsXAxisOnly="{Binding Source={x:Reference Name=zoomXAxisOnly}, Path=IsChecked, Mode=TwoWay}"
ZoomExtentsY="{Binding Source={x:Reference Name=zoomExtentsY}, Path=IsChecked, Mode=TwoWay}"
IsAnimated="{Binding Source={x:Reference Name=useAnimation}, Path=IsChecked, Mode=TwoWay}"
RubberBandFill="#55FFFFFF"
RubberBandStroke="#FFFFFFFF"
RubberBandStrokeDashArray="2 2">
</s:RubberBandXyZoomModifier>
<s:ZoomExtentsModifier IsAnimated="{Binding ElementName=useAnimation, Path=IsChecked, Mode=TwoWay}"/>
</s:ModifierGroup>
</s:SciChartSurface.ChartModifier>
</s:SciChartSurface>
</Grid>
</UserControl>
DragAreaToZoom.xaml.cs
View source code// *************************************************************************************
// SCICHART® Copyright SciChart Ltd. 2011-2022. All rights reserved.
//
// Web: http://www.scichart.com
// Support: support@scichart.com
// Sales: sales@scichart.com
//
// DragAreaToZoom.xaml.cs is part of the SCICHART® Examples. Permission is hereby granted
// to modify, create derivative works, distribute and publish any part of this source
// code whether for commercial, private or personal use.
//
// The SCICHART® examples are distributed in the hope that they will be useful, but
// without any warranty. It is provided "AS IS" without warranty of any kind, either
// expressed or implied.
// *************************************************************************************
using System.Windows;
using System.Windows.Controls;
using SciChart.Charting.Model.DataSeries;
using SciChart.Examples.ExternalDependencies.Data;
namespace SciChart.Examples.Examples.ZoomAndPanAChart
{
public partial class DragAreaToZoom : UserControl
{
public DragAreaToZoom()
{
InitializeComponent();
}
private void DragAreaToZoom_Loaded(object sender, RoutedEventArgs e)
{
// Performing multiple updates in a SuspendUpdates block is efficient as only one redraw is performed
using (sciChart.SuspendUpdates())
{
// Add some data series of type X=double, Y=double
var dataSeries0 = new XyDataSeries<double, double>();
var dataSeries1 = new XyDataSeries<double, double>();
var data2 = DataManager.Instance.GetFourierSeries(1.0, 0.1);
var data1 = DataManager.Instance.GetDampedSinewave(1500, 3.0, 0.0, 0.005, data2.Count);
// Append data to series.
dataSeries0.Append(data1.XData, data1.YData);
dataSeries1.Append(data2.XData, data2.YData);
lineSeries.DataSeries = dataSeries1;
mountainSeries.DataSeries = dataSeries0;
// Set initial zoom
sciChart.ZoomExtents();
}
}
}
}
