WPF Chart - Examples
SciChart WPF ships with hundreds of WPF Chart Examples which you can browse, play with, view the source-code and even export each WPF Chart Example to a stand-alone Visual Studio solution. All of this is possible with the new and improved SciChart WPF Examples Suite, which ships as part of the SciChart WPF SDK.
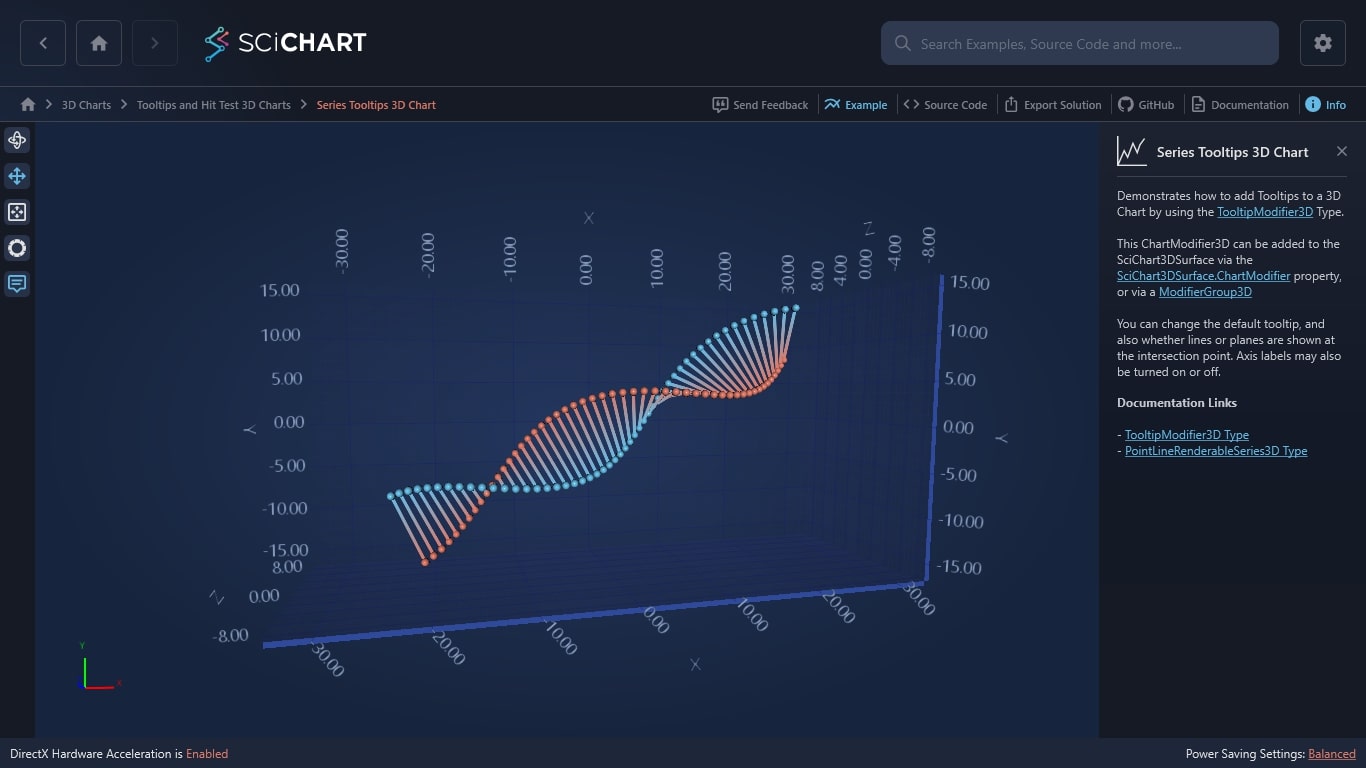
Demonstrates how to add Tooltips to a 3D Chart by using the TooltipModifier3D Type.
This ChartModifier3D can be added to the SciChart3DSurface via the SciChart3DSurface.ChartModifier property, or via a ModifierGroup3D
You can change the default tooltip, and also whether lines or planes are shown at the intersection point. Axis labels may also be turned on or off.
Documentation Links

The C#/WPF source code for the WPF 3D Chart Tooltips Example example is included below (Scroll down!).
Did you know you can also view the source code from one of the following sources as well?
- Clone the SciChart.WPF.Examples from Github.
- Or, view source in the SciChart WPF Examples suite.
- Also the SciChart WPF Trial contains the full source for the examples (link below).
SeriesTooltips3DChart.xaml
View source code<UserControl x:Class="SciChart.Examples.Examples.Charts3D.TooltipsAndHitTest3DCharts.SeriesTooltips3DChart"
xmlns="http://schemas.microsoft.com/winfx/2006/xaml/presentation"
xmlns:x="http://schemas.microsoft.com/winfx/2006/xaml"
xmlns:ext="http://schemas.abtsoftware.co.uk/scichart/exampleExternals"
xmlns:s3D="http://schemas.abtsoftware.co.uk/scichart3D"
xmlns:t3D="clr-namespace:SciChart.Charting3D.Modifiers.Tooltip3D;assembly=SciChart.Charting3D">
<Grid>
<Grid.ColumnDefinitions>
<ColumnDefinition Width="Auto" />
<ColumnDefinition Width="*" />
</Grid.ColumnDefinitions>
<ext:SciChart3DInteractionToolbar Grid.Column="0" TargetSurface="{Binding Source={x:Reference Name=SciChart}}" />
<s3D:SciChart3DSurface x:Name="SciChart"
Grid.Column="1"
BorderThickness="0"
WorldDimensions="600,300,180">
<s3D:SciChart3DSurface.Camera>
<s3D:Camera3D Position="-160, 190, -520" Target="-45,150,0" />
</s3D:SciChart3DSurface.Camera>
<s3D:SciChart3DSurface.RenderableSeries>
<!-- To create a Scatter Chart, create a ScatterRenderableSeries3D and use a 3D point marker type -->
<s3D:PointLineRenderableSeries3D IsLineStrips="False" StrokeThickness="4">
<s3D:PointLineRenderableSeries3D.PointMarker>
<s3D:SpherePointMarker3D Size="8.0" />
</s3D:PointLineRenderableSeries3D.PointMarker>
</s3D:PointLineRenderableSeries3D>
</s3D:SciChart3DSurface.RenderableSeries>
<s3D:SciChart3DSurface.XAxis>
<s3D:NumericAxis3D GrowBy="0.2,0.2" AxisTitle="X" AxisTitleOffset="60"/>
</s3D:SciChart3DSurface.XAxis>
<s3D:SciChart3DSurface.YAxis>
<s3D:NumericAxis3D GrowBy="0.1,0.1" AxisTitle="Y" AxisTitleOffset="60"/>
</s3D:SciChart3DSurface.YAxis>
<s3D:SciChart3DSurface.ZAxis>
<s3D:NumericAxis3D GrowBy="0.2,0.2" VisibleRange="-9,9" AxisTitle="Z" AxisTitleOffset="60"/>
</s3D:SciChart3DSurface.ZAxis>
<s3D:SciChart3DSurface.ChartModifier>
<s3D:ModifierGroup3D>
<s3D:OrbitModifier3D ExecuteOn="MouseLeftButton" />
<s3D:FreeLookModifier3D ExecuteOn="MouseLeftButton" />
<t3D:TooltipModifier3D CrosshairMode="Lines" CrosshairPlanesFill="#33FF6600" />
<s3D:MouseWheelZoomModifier3D />
<s3D:ZoomExtentsModifier3D AnimateDurationMs="500"
ResetPosition="-160, 190, -520"
ResetTarget="-45,150,0" />
</s3D:ModifierGroup3D>
</s3D:SciChart3DSurface.ChartModifier>
</s3D:SciChart3DSurface>
</Grid>
</UserControl>SeriesTooltips3DChart.xaml.cs
View source code// *************************************************************************************
// SCICHART® Copyright SciChart Ltd. 2011-2022. All rights reserved.
//
// Web: http://www.scichart.com
// Support: support@scichart.com
// Sales: sales@scichart.com
//
// SeriesTooltips3DChart.xaml.cs is part of the SCICHART® Examples. Permission is hereby granted
// to modify, create derivative works, distribute and publish any part of this source
// code whether for commercial, private or personal use.
//
// The SCICHART® examples are distributed in the hope that they will be useful, but
// without any warranty. It is provided "AS IS" without warranty of any kind, either
// expressed or implied.
// *************************************************************************************
using System;
using System.Windows;
using System.Windows.Controls;
using System.Windows.Media;
using System.Windows.Media.Media3D;
using SciChart.Charting3D.Model;
namespace SciChart.Examples.Examples.Charts3D.TooltipsAndHitTest3DCharts
{
/// <summary>
/// Interaction logic for SeriesTooltips3DChart.xaml
/// </summary>
public partial class SeriesTooltips3DChart : UserControl
{
private const int SegmentsCount = 25;
private const double YAngle = -65;
private readonly Color _blueColor = Color.FromArgb(0xFF, 0x00, 0x84, 0xCF);
private readonly Color _redColor = Color.FromArgb(0xFF, 0xEE, 0x11, 0x10);
private readonly double _rotationAngle;
public SeriesTooltips3DChart()
{
InitializeComponent();
_rotationAngle = 360d / 45;
Loaded += (sender, args) => Initialize();
}
private void Initialize()
{
var xyzDataSeries3D = new XyzDataSeries3D<double>();
var currentAngle = 0d;
for (var i = -SegmentsCount; i < SegmentsCount + 1; i++)
{
AddSegment(xyzDataSeries3D, i, currentAngle);
currentAngle = (currentAngle + _rotationAngle) % 360;
}
SciChart.RenderableSeries[0].DataSeries = xyzDataSeries3D;
}
private void AddSegment(IXyzDataSeries3D<double, double, double> xyzDataSeries3D, double y, double currentAngle)
{
var temp = RotatePoint(new Point(-4, 0), DegreeToRadian(currentAngle));
var point = RotateAroundZ(new Point3D(temp.X, y, temp.Y), DegreeToRadian(YAngle));
xyzDataSeries3D.Append(point.X, point.Y, point.Z, new PointMetadata3D(_blueColor));
temp = RotatePoint(new Point(4, 0), DegreeToRadian(currentAngle));
point = RotateAroundZ(new Point3D(temp.X, y, temp.Y), DegreeToRadian(YAngle));
xyzDataSeries3D.Append(point.X, point.Y, point.Z, new PointMetadata3D(_redColor));
}
private Point RotatePoint(Point point, double angle)
{
var x = point.X * Math.Cos(angle) - point.Y * Math.Sin(angle);
var y = point.X * Math.Sin(angle) + point.Y * Math.Cos(angle);
return new Point(x, y);
}
private Point3D RotateAroundZ(Point3D point, double angle)
{
var x = point.X * Math.Cos(angle) - point.Y * Math.Sin(angle);
var y = point.X * Math.Sin(angle) + point.Y * Math.Cos(angle);
return new Point3D(x, y, point.Z);
}
private double DegreeToRadian(double angle)
{
return Math.PI * angle / 180.0;
}
}
}