WPF Chart - Examples
SciChart WPF ships with hundreds of WPF Chart Examples which you can browse, play with, view the source-code and even export each WPF Chart Example to a stand-alone Visual Studio solution. All of this is possible with the new and improved SciChart WPF Examples Suite, which ships as part of the SciChart WPF SDK.
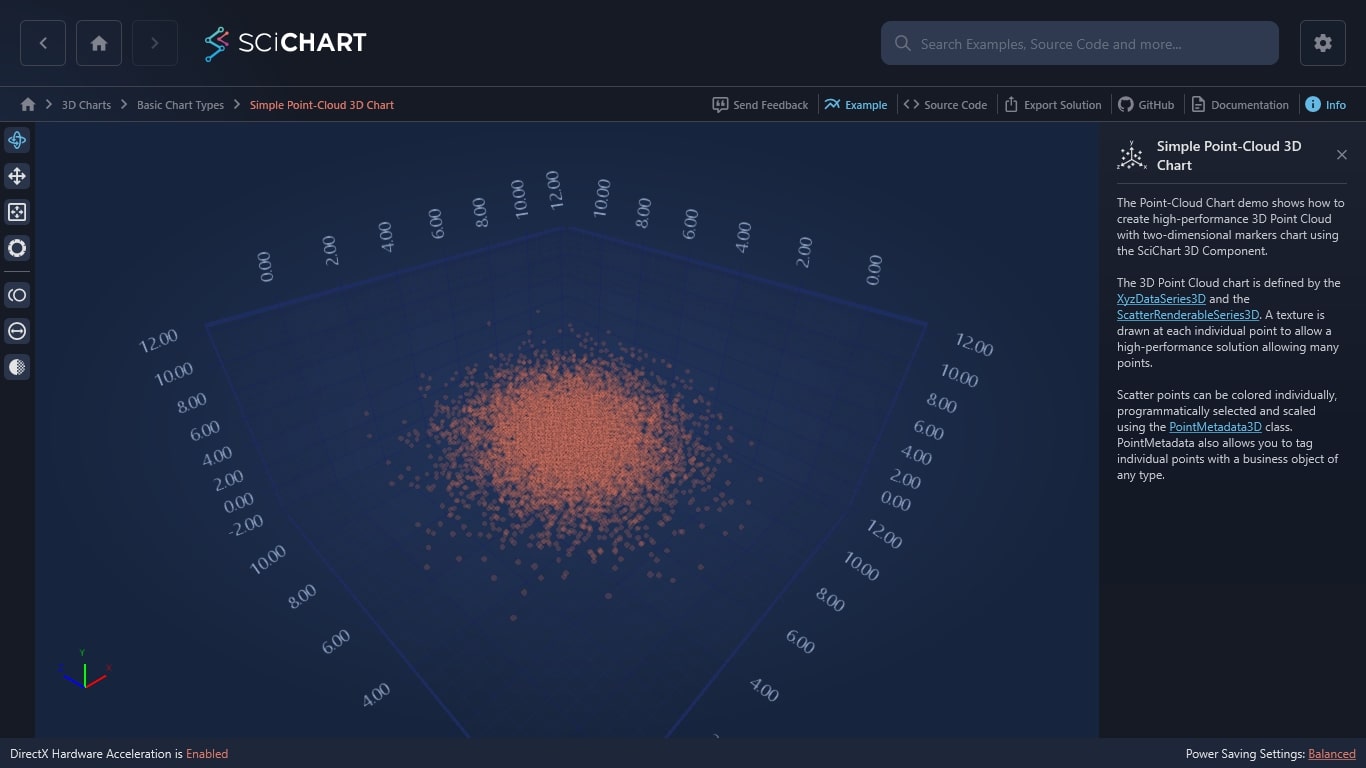
The Point-Cloud Chart demo shows how to create high-performance WPF 3D Point Cloud with two-dimensional markers chart using the SciChart 3D Component.
The 3D Point Cloud chart is defined by the XyzDataSeries3D and the ScatterRenderableSeries3D. A texture is drawn at each individual point to allow a high-performance solution allowing many points.
Scatter points can be colored individually, programmatically selected and scaled using the PointMetadata3D class. PointMetadata also allows you to tag individual points with a business object of any type.

The C#/WPF source code for the WPF 3D Point Cloud Chart Example example is included below (Scroll down!).
Did you know you can also view the source code from one of the following sources as well?
- Clone the SciChart.WPF.Examples from Github.
- Or, view source in the SciChart WPF Examples suite.
- Also the SciChart WPF Trial contains the full source for the examples (link below).
CreateAPointCloud3DChart.xaml
View source code<UserControl x:Class="SciChart.Examples.Examples.Charts3D.CreateA3DChart.CreateAPointCloud3DChart"
xmlns="http://schemas.microsoft.com/winfx/2006/xaml/presentation"
xmlns:x="http://schemas.microsoft.com/winfx/2006/xaml"
xmlns:d="http://schemas.microsoft.com/expression/blend/2008"
xmlns:ext="http://schemas.abtsoftware.co.uk/scichart/exampleExternals"
xmlns:mc="http://schemas.openxmlformats.org/markup-compatibility/2006"
xmlns:s3D="http://schemas.abtsoftware.co.uk/scichart3D"
xmlns:createA3DChart="clr-namespace:SciChart.Examples.Examples.Charts3D.CreateA3DChart"
d:DesignHeight="400"
d:DesignWidth="600"
mc:Ignorable="d">
<UserControl.Resources>
<!-- CustomPointMarker3D allows a VisualBrush, SolidColorBrush, ImageBrush etc... to be placed on a point-marker -->
<s3D:CustomPointMarker3D x:Key="CustomPointMarkerResource">
<s3D:CustomPointMarker3D.Brush>
<VisualBrush>
<VisualBrush.Visual>
<Canvas Width="512" Height="512" Background="Yellow" Grid.Row="1" HorizontalAlignment="Left">
<Ellipse Fill="Black" Width="75" Height="75" Canvas.Left="125" Canvas.Top="150"/>
<Ellipse Fill="Black" Width="75" Height="75" Canvas.Left="325" Canvas.Top="150"/>
<Path Stroke="Black" Data="M 125,300 S 225,400 325, 300" StrokeThickness="20" StrokeEndLineCap="Round" StrokeStartLineCap="Round" Canvas.Left="35" />
</Canvas>
</VisualBrush.Visual>
</VisualBrush>
</s3D:CustomPointMarker3D.Brush>
</s3D:CustomPointMarker3D>
</UserControl.Resources>
<Grid>
<Grid.ColumnDefinitions>
<ColumnDefinition Width="Auto" />
<ColumnDefinition Width="*" />
</Grid.ColumnDefinitions>
<!-- The SciChart3DInteractionToolbar adds rotate, orbit, zoom, pan, zoom extents functionality -->
<!-- to the chart and is included for example purposes. -->
<!-- If you wish to know how to zoom and pan a 3D chart then do a search for Zoom Pan in the Examples suite! -->
<ext:SciChart3DInteractionToolbar TargetSurface="{Binding Source={x:Reference Name=SciChart}}">
<ext:FlyoutSeparator Background="#444" />
<ext:FlyoutMenuButton Content="PM"
Padding="0"
Style="{StaticResource FlyoutMenuButtonStyle}">
<ext:FlyoutMenuButton.PopupContent>
<StackPanel MinWidth="150" Orientation="Vertical">
<TextBlock Text="PointMarker3D Type" />
<ext:FlyoutSeparator />
<ComboBox x:Name="PointMarkerCombo"
SelectedIndex="0"
DisplayMemberPath="Name"
SelectionChanged="PointMarkerCombo_OnSelectionChanged">
</ComboBox>
</StackPanel>
</ext:FlyoutMenuButton.PopupContent>
</ext:FlyoutMenuButton>
<ext:FlyoutMenuButton Content="SIZE"
Padding="0"
Style="{StaticResource FlyoutMenuButtonStyle}">
<ext:FlyoutMenuButton.PopupContent>
<StackPanel MinWidth="150" Orientation="Vertical">
<TextBlock Text="Slide to change PointMarker Size" />
<ext:FlyoutSeparator />
<!-- Create the size slider -->
<Slider x:Name="SizeSlider"
Margin="4"
HorizontalAlignment="Stretch"
Maximum="3.0"
Minimum="0.1"
Orientation="Horizontal"
ValueChanged="SizeSlider_OnValueChanged"
Value="1.0" />
</StackPanel>
</ext:FlyoutMenuButton.PopupContent>
</ext:FlyoutMenuButton>
<ext:FlyoutMenuButton Content="OP"
Padding="0"
Style="{StaticResource FlyoutMenuButtonStyle}">
<ext:FlyoutMenuButton.PopupContent>
<StackPanel MinWidth="150" Orientation="Vertical">
<TextBlock Text="Slide to change PointMarker Opacity" />
<ext:FlyoutSeparator />
<!-- Create the opacity slider -->
<Slider x:Name="OpacitySlider"
Margin="4"
HorizontalAlignment="Stretch"
Maximum="1.0"
Minimum="0.1"
Orientation="Horizontal"
ValueChanged="OpacitySlider_OnValueChanged"
Value="0.7" />
</StackPanel>
</ext:FlyoutMenuButton.PopupContent>
</ext:FlyoutMenuButton>
</ext:SciChart3DInteractionToolbar>
<s3D:SciChart3DSurface x:Name="SciChart"
Grid.Column="1"
BorderThickness="0"
WorldDimensions="200,100,200">
<s3D:SciChart3DSurface.Camera>
<s3D:Camera3D ZoomToFitOnAttach="True" />
</s3D:SciChart3DSurface.Camera>
<s3D:SciChart3DSurface.RenderableSeries>
<s3D:ScatterRenderableSeries3D x:Name="ScatterSeries3D">
<s3D:ScatterRenderableSeries3D.PointMarker>
<s3D:EllipsePointMarker3D Fill="#77ADFF2F" Size="1.0" Opacity="1"/>
</s3D:ScatterRenderableSeries3D.PointMarker>
</s3D:ScatterRenderableSeries3D>
</s3D:SciChart3DSurface.RenderableSeries>
<s3D:SciChart3DSurface.XAxis>
<s3D:NumericAxis3D GrowBy="0.1,0.1" />
</s3D:SciChart3DSurface.XAxis>
<s3D:SciChart3DSurface.YAxis>
<s3D:NumericAxis3D GrowBy="0.1,0.1" NegativeSideClipping="VisibleRange" PositiveSideClipping="VisibleRange" />
</s3D:SciChart3DSurface.YAxis>
<s3D:SciChart3DSurface.ZAxis>
<s3D:NumericAxis3D GrowBy="0.1,0.1" />
</s3D:SciChart3DSurface.ZAxis>
</s3D:SciChart3DSurface>
</Grid>
</UserControl>CreateAPointCloud3DChart.xaml.cs
View source code// *************************************************************************************
// SCICHART® Copyright SciChart Ltd. 2011-2022. All rights reserved.
//
// Web: http://www.scichart.com
// Support: support@scichart.com
// Sales: sales@scichart.com
//
// CreateAPointCloud3DChart.xaml.cs is part of the SCICHART® Examples. Permission is hereby granted
// to modify, create derivative works, distribute and publish any part of this source
// code whether for commercial, private or personal use.
//
// The SCICHART® examples are distributed in the hope that they will be useful, but
// without any warranty. It is provided "AS IS" without warranty of any kind, either
// expressed or implied.
// *************************************************************************************
using System;
using System.Windows;
using System.Windows.Controls;
using System.Windows.Media;
using SciChart.Charting3D.Model;
using SciChart.Charting3D.PointMarkers;
using SciChart.Examples.ExternalDependencies.Data;
namespace SciChart.Examples.Examples.Charts3D.CreateA3DChart
{
public partial class CreateAPointCloud3DChart : UserControl
{
public CreateAPointCloud3DChart()
{
InitializeComponent();
PointMarkerCombo.Items.Add(typeof(EllipsePointMarker3D));
PointMarkerCombo.Items.Add(typeof(QuadPointMarker3D));
PointMarkerCombo.Items.Add(typeof(TrianglePointMarker3D));
PointMarkerCombo.Items.Add(typeof(PixelPointMarker3D));
PointMarkerCombo.Items.Add(typeof(CustomPointMarker3D));
Loaded += OnLoaded;
}
private void OnLoaded(object sender, RoutedEventArgs routedEventArgs)
{
var xyzDataSeries3D = new XyzDataSeries3D<double>();
const int count = 10000;
for (int i = 0; i < count; i++)
{
var x = DataManager.Instance.GetGaussianRandomNumber(5, 1.5);
var y = DataManager.Instance.GetGaussianRandomNumber(5, 1.5);
var z = DataManager.Instance.GetGaussianRandomNumber(5, 1.5);
xyzDataSeries3D.Append(x, y, z);
}
ScatterSeries3D.DataSeries = xyzDataSeries3D;
PointMarkerCombo.SelectedIndex = 0;
}
private void PointMarkerCombo_OnSelectionChanged(object sender, SelectionChangedEventArgs e)
{
if (ScatterSeries3D != null && OpacitySlider != null && SizeSlider != null)
{
var pmType = (Type) ((ComboBox) sender).SelectedItem;
// Special case. CustomPointMarker is defined in the XAML as it contains a custom brush
if (pmType == typeof(CustomPointMarker3D))
{
var pointMarker = (CustomPointMarker3D)this.TryFindResource("CustomPointMarkerResource");
ScatterSeries3D.PointMarker = pointMarker;
}
else
{
// Create an instance of the pointmarker we want to draw
var pointMarker = (BasePointMarker3D)Activator.CreateInstance(pmType);
ScatterSeries3D.PointMarker = pointMarker;
}
ScatterSeries3D.PointMarker.Fill = Color.FromArgb(0x77, 0xAD, 0xFF, 0x2F);
ScatterSeries3D.PointMarker.Size = (float)SizeSlider.Value;
ScatterSeries3D.PointMarker.Opacity = OpacitySlider.Value;
}
}
private void SizeSlider_OnValueChanged(object sender, RoutedPropertyChangedEventArgs<double> e)
{
if (ScatterSeries3D != null && ScatterSeries3D.PointMarker != null)
ScatterSeries3D.PointMarker.Size = (float)((Slider)sender).Value;
}
private void OpacitySlider_OnValueChanged(object sender, RoutedPropertyChangedEventArgs<double> e)
{
if (ScatterSeries3D != null && ScatterSeries3D.PointMarker != null)
ScatterSeries3D.PointMarker.Opacity = ((Slider)sender).Value;
}
}
}