WPF Chart - Examples
SciChart WPF ships with hundreds of WPF Chart Examples which you can browse, play with, view the source-code and even export each WPF Chart Example to a stand-alone Visual Studio solution. All of this is possible with the new and improved SciChart WPF Examples Suite, which ships as part of the SciChart WPF SDK.
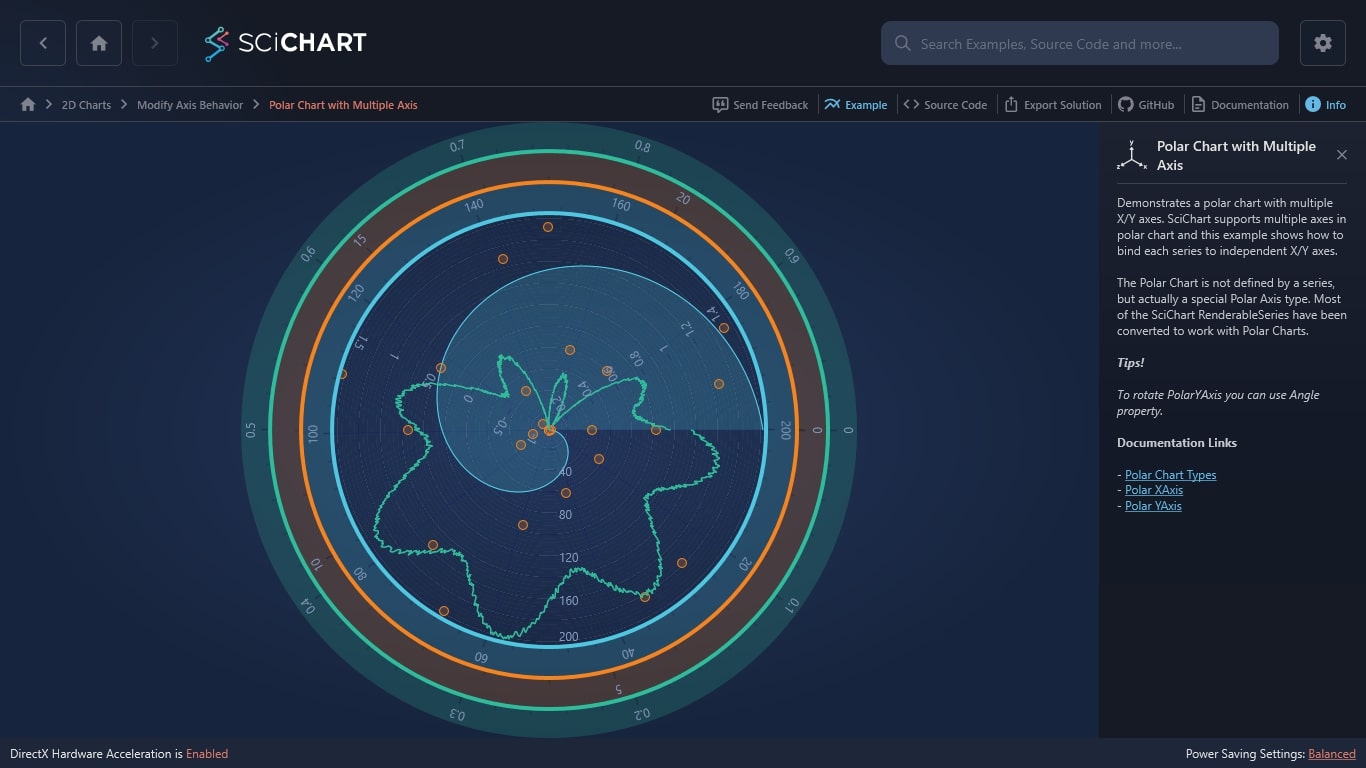
Demonstrates a polar chart with multiple X/Y axes. SciChart supports multiple axes in polar chart and this example shows how to bind each series to independent X/Y axes.
The Polar Chart is not defined by a series, but actually a special Polar Axis type. Most of the SciChart RenderableSeries have been converted to work with Polar Charts.
Tips!
To rotate PolarYAxis you can use Angle property.
Documentation Links

The C#/WPF source code for the WPF Polar Chart with Multiple Axis example is included below (Scroll down!).
Did you know you can also view the source code from one of the following sources as well?
- Clone the SciChart.WPF.Examples from Github.
- Or, view source in the SciChart WPF Examples suite.
- Also the SciChart WPF Trial contains the full source for the examples (link below).
PolarChartWithMultipleAxes.xaml
View source code<UserControl x:Class="SciChart.Examples.Examples.ModifyAxisBehaviour.PolarChartWithMultipleAxes"
xmlns="http://schemas.microsoft.com/winfx/2006/xaml/presentation"
xmlns:x="http://schemas.microsoft.com/winfx/2006/xaml"
xmlns:d="http://schemas.microsoft.com/expression/blend/2008"
xmlns:mc="http://schemas.openxmlformats.org/markup-compatibility/2006"
xmlns:s="http://schemas.abtsoftware.co.uk/scichart"
Loaded="PolarChartWithMultipleAxes_OnLoaded"
d:DesignHeight="400"
d:DesignWidth="600"
mc:Ignorable="d">
<Grid>
<s:SciChartSurface Name="sciChart">
<s:SciChartSurface.RenderableSeries>
<s:FastMountainRenderableSeries Name="mountainSeries"
Fill="#80012E94"
Stroke="#012E94"
XAxisId="XAxis1"
YAxisId="YAxis1" />
<s:XyScatterRenderableSeries Name="scatterSeries"
XAxisId="XAxis2"
YAxisId="YAxis2">
<s:XyScatterRenderableSeries.PointMarker>
<s:EllipsePointMarker Width="10"
Height="10"
Fill="#0F5C04"
Stroke="Black" />
</s:XyScatterRenderableSeries.PointMarker>
</s:XyScatterRenderableSeries>
<s:FastLineRenderableSeries Name="lineSeries"
Stroke="#FE0B21"
StrokeThickness="2"
XAxisId="XAxis3"
YAxisId="YAxis3" />
</s:SciChartSurface.RenderableSeries>
<s:SciChartSurface.XAxes>
<s:PolarXAxis Background="#50012E94"
BorderBrush="#FF012E94"
BorderThickness="0,0,0,4"
Id="XAxis1" />
<s:PolarXAxis Background="#500F5C04"
BorderBrush="#FF0F5C04"
BorderThickness="0,0,0,4"
Id="XAxis2" />
<s:PolarXAxis Background="#50FE0B21"
BorderBrush="#FFFE0B21"
BorderThickness="0,0,0,4"
Id="XAxis3" />
</s:SciChartSurface.XAxes>
<s:SciChartSurface.YAxes>
<s:PolarYAxis Angle="0" Id="YAxis1" />
<s:PolarYAxis Angle="120" Id="YAxis2" />
<s:PolarYAxis Angle="240" Id="YAxis3" />
</s:SciChartSurface.YAxes>
<s:SciChartSurface.ChartModifier>
<s:ModifierGroup>
<s:ZoomExtentsModifier />
<s:RubberBandXyZoomModifier IsXAxisOnly="True" />
</s:ModifierGroup>
</s:SciChartSurface.ChartModifier>
</s:SciChartSurface>
</Grid>
</UserControl>
PolarChartWithMultipleAxes.xaml.cs
View source code// *************************************************************************************
// SCICHART® Copyright SciChart Ltd. 2011-2022. All rights reserved.
//
// Web: http://www.scichart.com
// Support: support@scichart.com
// Sales: sales@scichart.com
//
// PolarChartWithMultipleAxes.xaml.cs is part of the SCICHART® Examples. Permission is hereby granted
// to modify, create derivative works, distribute and publish any part of this source
// code whether for commercial, private or personal use.
//
// The SCICHART® examples are distributed in the hope that they will be useful, but
// without any warranty. It is provided "AS IS" without warranty of any kind, either
// expressed or implied.
// *************************************************************************************
using System.Windows;
using System.Windows.Controls;
using SciChart.Charting.Model.DataSeries;
using SciChart.Examples.ExternalDependencies.Data;
namespace SciChart.Examples.Examples.ModifyAxisBehaviour
{
/// <summary>
/// Interaction logic for PolarChartWithMultipleAxes.xaml
/// </summary>
public partial class PolarChartWithMultipleAxes : UserControl
{
public PolarChartWithMultipleAxes()
{
InitializeComponent();
}
private void PolarChartWithMultipleAxes_OnLoaded(object sender, RoutedEventArgs e)
{
var dataSeries1 = new XyDataSeries<double, double>();
var dataSeries2 = new XyDataSeries<double, double>();
var dataSeries3 = new XyDataSeries<double, double>();
var data1 = DataManager.Instance.GetSquirlyWave();
var data2 = DataManager.Instance.GetStraightLine(1, 1, 200);
var data3 = DataManager.Instance.GetRandomDoubleSeries(25);
dataSeries1.Append(data1.XData, data1.YData);
dataSeries2.Append(data2.XData, data2.YData);
dataSeries3.Append(data3.XData, data3.YData);
lineSeries.DataSeries = dataSeries1;
mountainSeries.DataSeries = dataSeries2;
scatterSeries.DataSeries = dataSeries3;
sciChart.ZoomExtents();
}
}
}
