WPF Chart - Examples
SciChart WPF ships with hundreds of WPF Chart Examples which you can browse, play with, view the source-code and even export each WPF Chart Example to a stand-alone Visual Studio solution. All of this is possible with the new and improved SciChart WPF Examples Suite, which ships as part of the SciChart WPF SDK.
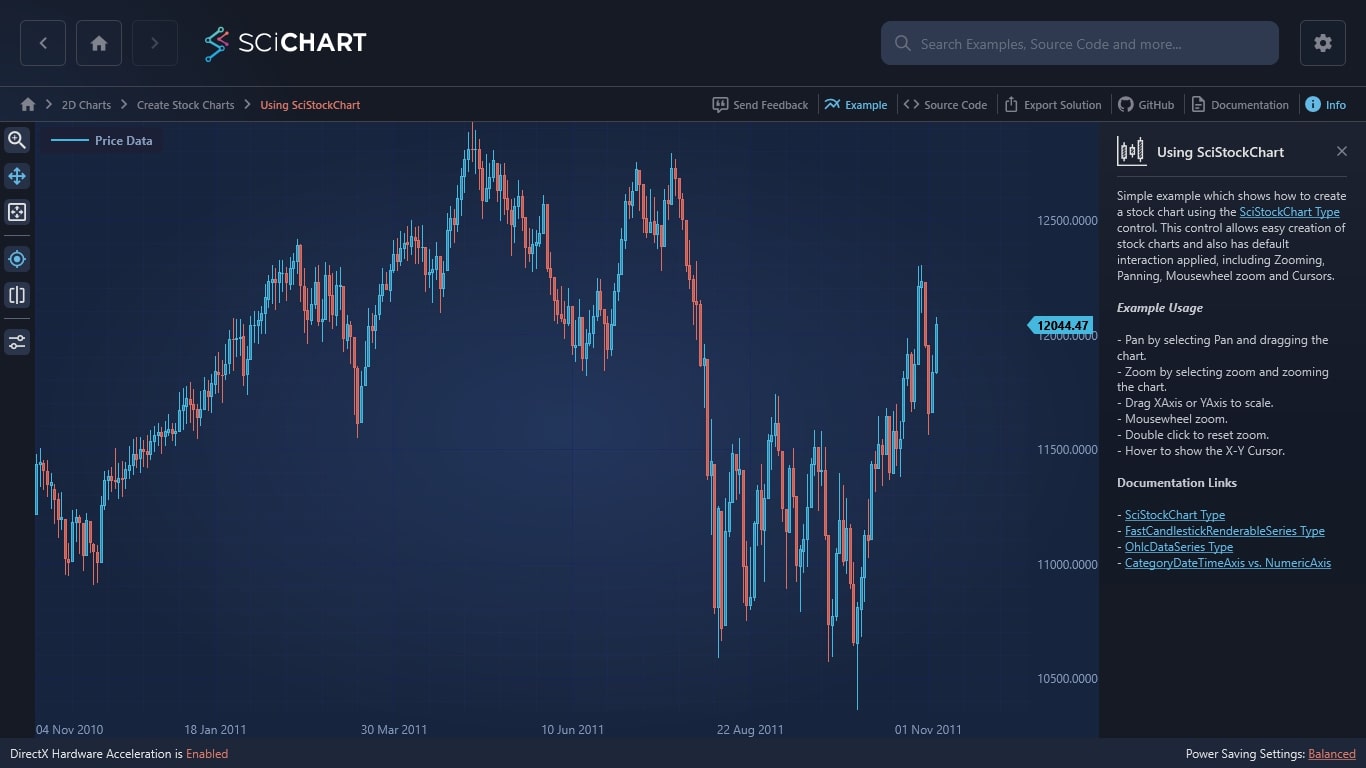
Simple example which shows how to create a stock chart using the SciStockChart Type control. This control allows easy creation of stock charts and also has default interaction applied, including Zooming, Panning, Mousewheel zoom and Cursors.
Example Usage
– Pan by selecting Pan and dragging the chart.
– Zoom by selecting zoom and zooming the chart.
– Drag XAxis or YAxis to scale.
– Mousewheel zoom.
– Double click to reset zoom.
– Hover to show the X-Y Cursor.
Documentation Links
– SciStockChart Type
– FastCandlestickRenderableSeries Type
– OhlcDataSeries Type
– CategoryDateTimeAxis vs. NumericAxis

The C#/WPF source code for the WPF Stock Chart Control example is included below (Scroll down!).
Did you know you can also view the source code from one of the following sources as well?
- Clone the SciChart.WPF.Examples from Github.
- Or, view source in the SciChart WPF Examples suite.
- Also the SciChart WPF Trial contains the full source for the examples (link below).
CreateSimpleStockChart.xaml
View source code<UserControl x:Class="SciChart.Examples.Examples.CreateStockCharts.CreateSimpleStockChart"
xmlns="http://schemas.microsoft.com/winfx/2006/xaml/presentation"
xmlns:x="http://schemas.microsoft.com/winfx/2006/xaml"
xmlns:s="http://schemas.abtsoftware.co.uk/scichart"
Loaded="CreateSciTradeChartLoaded"
xmlns:mc="http://schemas.openxmlformats.org/markup-compatibility/2006"
xmlns:d="http://schemas.microsoft.com/expression/blend/2008"
xmlns:ext="http://schemas.abtsoftware.co.uk/scichart/exampleExternals"
d:DesignHeight="400"
d:DesignWidth="600"
mc:Ignorable="d">
<UserControl.Resources>
<ResourceDictionary>
<ResourceDictionary.MergedDictionaries>
<ResourceDictionary Source="/SciChart.Examples.ExternalDependencies;component/Resources/Styles/MergedResources.xaml" />
</ResourceDictionary.MergedDictionaries>
</ResourceDictionary>
</UserControl.Resources>
<Grid>
<Grid.ColumnDefinitions>
<ColumnDefinition Width="Auto" />
<ColumnDefinition Width="*" />
</Grid.ColumnDefinitions>
<Border Background="#FF232426" BorderThickness="0,0,2,0" BorderBrush="#323539" Canvas.ZIndex="9999">
<StackPanel Orientation="Vertical">
<ToggleButton IsChecked="{Binding Source={x:Reference Name=StockChart}, Path=IsRubberBandZoomEnabled, Mode=TwoWay}"
Style="{StaticResource ZoomButtonStyle}"
s:ToggleButtonExtensions.GroupName="CreateSciStockChart_ZoomGroup"/>
<ToggleButton IsChecked="{Binding Source={x:Reference Name=StockChart}, Path=IsPanEnabled, Mode=TwoWay}"
Style="{StaticResource PanButtonStyle}"
s:ToggleButtonExtensions.GroupName="CreateSciStockChart_ZoomGroup"/>
<Button Command="{Binding Source={x:Reference Name=StockChart}, Path=AnimateZoomExtentsCommand}" Style="{StaticResource ZoomExtentsButtonStyle}"/>
<ext:FlyoutSeparator Background="#444"/>
<ToggleButton Margin="3" Style="{StaticResource PointerButtonStyle}"
ToolTipService.ToolTip="Enable CursorModifier"
IsChecked="{Binding Source={x:Reference Name=StockChart}, Path=IsCursorEnabled, Mode=TwoWay}"
s:ToggleButtonExtensions.GroupName="CreateSciStockChart_CursorGroup"/>
<ToggleButton Margin="3" Style="{StaticResource CalloutButtonStyle}"
ToolTipService.ToolTip="Enable RolloverModifier"
IsChecked="{Binding Source={x:Reference Name=StockChart}, Path=IsRolloverEnabled, Mode=TwoWay}"
s:ToggleButtonExtensions.GroupName="CreateSciStockChart_CursorGroup"/>
<ext:FlyoutSeparator Background="#444"/>
<ext:FlyoutMenuButton Style="{StaticResource FlyoutMenuButtonStyle}" Content="CTRL" Padding="0">
<ext:FlyoutMenuButton.PopupContent>
<StackPanel Orientation="Vertical" MinWidth="150" Margin="0,0,0,4">
<TextBlock Text="Additional Controls" />
<ext:FlyoutSeparator/>
<CheckBox Margin="4" Content="SciStockChart.ShowLegend" IsChecked="{Binding Source={x:Reference Name=StockChart}, Path=ShowLegend, Mode=TwoWay}" />
<CheckBox Margin="4" Content="SciStockChart.IsAxisMarkersEnabled" IsChecked="{Binding Source={x:Reference Name=StockChart}, Path=IsAxisMarkersEnabled, Mode=TwoWay}" />
<CheckBox Margin="4" Content="SciStockChart.IsXAxisVisible" IsChecked="{Binding Source={x:Reference Name=StockChart}, Path=IsXAxisVisible, Mode=TwoWay}" />
</StackPanel>
</ext:FlyoutMenuButton.PopupContent>
</ext:FlyoutMenuButton>
</StackPanel>
</Border>
<!-- Create the SciStockChart. In the code-behind we append data and add series -->
<s:SciStockChart x:Name="StockChart"
Grid.Column="1">
<!-- Override any property of the built-in CategoryDateTimeAxis here -->
<s:SciStockChart.XAxisStyle>
<Style TargetType="s:CategoryDateTimeAxis">
<Setter Property="DrawMinorGridLines" Value="True" />
<Setter Property="DrawMajorGridLines" Value="True" />
<Setter Property="DrawMajorBands" Value="True" />
<Setter Property="MinorsPerMajor" Value="5" />
<Setter Property="TextFormatting" Value="dd MMM yyyy" />
<Setter Property="GrowBy" Value="0, 0.1" />
</Style>
</s:SciStockChart.XAxisStyle>
<!-- Override any property of the built-in NumericAxis here -->
<s:SciStockChart.YAxisStyle>
<Style TargetType="s:NumericAxis">
<Setter Property="DrawMinorGridLines" Value="True" />
<Setter Property="DrawMajorGridLines" Value="True" />
<Setter Property="DrawMajorBands" Value="False" />
<Setter Property="MinorsPerMajor" Value="5" />
<Setter Property="TextFormatting" Value="0.0000" />
</Style>
</s:SciStockChart.YAxisStyle>
<s:SciStockChart.RenderableSeries>
<s:FastCandlestickRenderableSeries AntiAliasing="False" />
</s:SciStockChart.RenderableSeries>
</s:SciStockChart>
</Grid>
</UserControl>
CreateSimpleStockChart.xaml.cs
View source code// *************************************************************************************
// SCICHART® Copyright SciChart Ltd. 2011-2022. All rights reserved.
//
// Web: http://www.scichart.com
// Support: support@scichart.com
// Sales: sales@scichart.com
//
// CreateSimpleStockChart.xaml.cs is part of the SCICHART® Examples. Permission is hereby granted
// to modify, create derivative works, distribute and publish any part of this source
// code whether for commercial, private or personal use.
//
// The SCICHART® examples are distributed in the hope that they will be useful, but
// without any warranty. It is provided "AS IS" without warranty of any kind, either
// expressed or implied.
// *************************************************************************************
using System;
using System.Windows;
using System.Windows.Controls;
using SciChart.Charting.Model.DataSeries;
using SciChart.Examples.ExternalDependencies.Common;
using SciChart.Examples.ExternalDependencies.Data;
namespace SciChart.Examples.Examples.CreateStockCharts
{
public partial class CreateSimpleStockChart : UserControl
{
public CreateSimpleStockChart()
{
InitializeComponent();
}
private void CreateSciTradeChartLoaded(object sender, RoutedEventArgs e)
{
var dataSeries = new OhlcDataSeries<DateTime, double>()
{
// Note: SeriesName is needed to display the legend correctly.
SeriesName = "Price Data"
};
// Append price data
var prices = DataManager.Instance.GetPriceData(Instrument.Indu.Value, TimeFrame.Daily);
dataSeries.Append(prices.TimeData, prices.OpenData, prices.HighData, prices.LowData, prices.CloseData);
// Set BarTimeFrame = 3600 seconds (time of one bar in the input data)
StockChart.BarTimeFrame = TimeSpan.FromHours(1).TotalSeconds;
StockChart.RenderableSeries[0].DataSeries = dataSeries;
}
}
}
