WPF Chart - Examples
SciChart WPF ships with hundreds of WPF Chart Examples which you can browse, play with, view the source-code and even export each WPF Chart Example to a stand-alone Visual Studio solution. All of this is possible with the new and improved SciChart WPF Examples Suite, which ships as part of the SciChart WPF SDK.
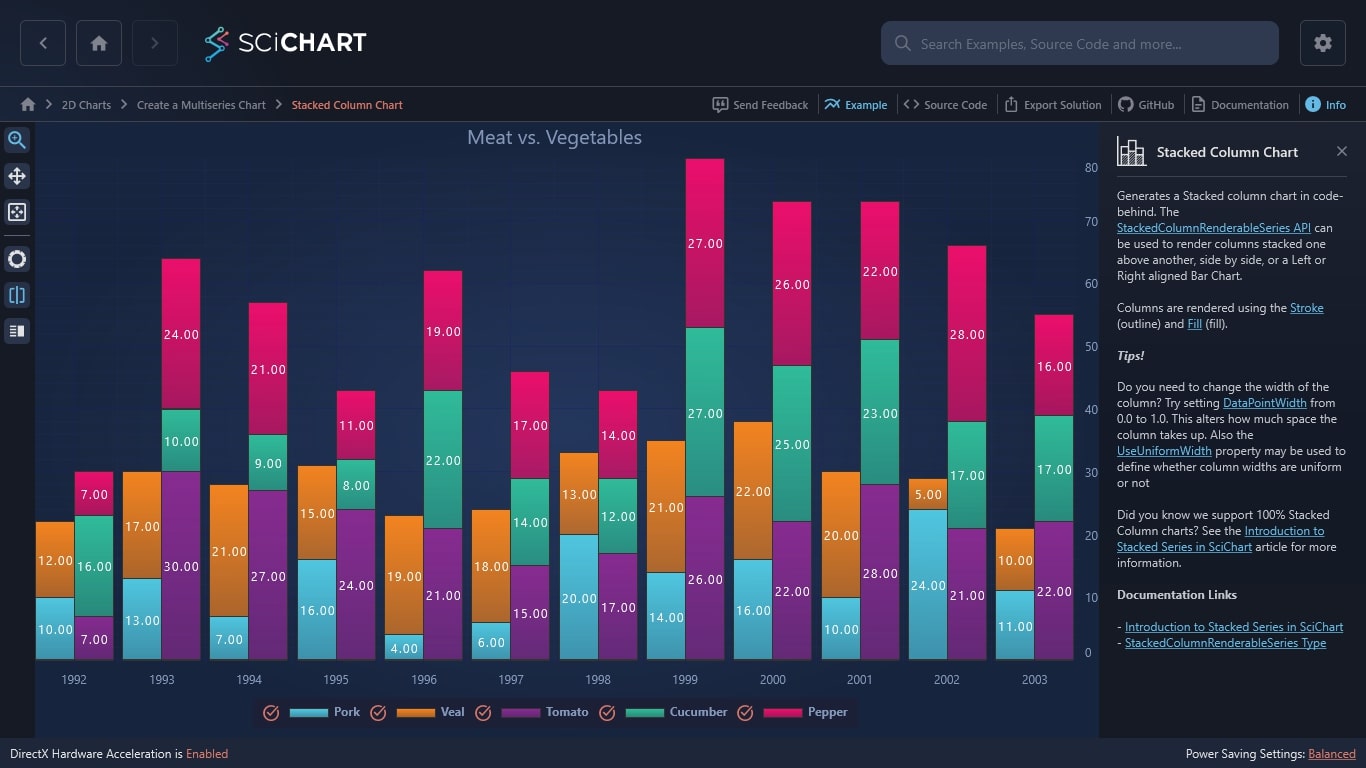
Generates a WPF Stacked column chart in code-behind. The StackedColumnRenderableSeries API can be used to render columns stacked one above another, side by side, or a Left or Right aligned Bar Chart.
Columns are rendered using the Stroke (outline) and Fill (fill).
Tips!
Do you need to change the width of the column? Try setting DataPointWidth from 0.0 to 1.0. This alters how much space the column takes up. Also the UseUniformWidth property may be used to define whether column widths are uniform or not
Did you know we support 100% Stacked Column charts? See the Introduction to Stacked Series in SciChart article for more information.
Documentation Links
– Introduction to Stacked Series in SciChart
– StackedColumnRenderableSeries Type

The C#/WPF source code for the WPF Stacked Column Chart example is included below (Scroll down!).
Did you know you can also view the source code from one of the following sources as well?
- Clone the SciChart.WPF.Examples from Github.
- Or, view source in the SciChart WPF Examples suite.
- Also the SciChart WPF Trial contains the full source for the examples (link below).
StackedColumnChartExampleView.xaml
View source code<UserControl x:Class="SciChart.Examples.Examples.CreateMultiseriesChart.StackedColumnChartExampleView"
xmlns="http://schemas.microsoft.com/winfx/2006/xaml/presentation"
xmlns:x="http://schemas.microsoft.com/winfx/2006/xaml"
xmlns:d="http://schemas.microsoft.com/expression/blend/2008"
xmlns:ext="http://schemas.abtsoftware.co.uk/scichart/exampleExternals"
xmlns:mc="http://schemas.openxmlformats.org/markup-compatibility/2006"
xmlns:s="http://schemas.abtsoftware.co.uk/scichart"
Loaded="StackedColumnChartExampleView_OnLoaded"
d:DesignHeight="400"
d:DesignWidth="600"
mc:Ignorable="d">
<UserControl.Resources>
<Style TargetType="s:StackedColumnRenderableSeries">
<Setter Property="Spacing" Value="0" />
<Setter Property="ShowLabel" Value="True" />
<Setter Property="Stroke" Value="#333" />
<Setter Property="DataPointWidth" Value="0.9" />
</Style>
</UserControl.Resources>
<Grid>
<Grid.ColumnDefinitions>
<ColumnDefinition Width="Auto" />
<ColumnDefinition Width="*" />
</Grid.ColumnDefinitions>
<!-- The SciChartInteractionToolbar adds zoom, pan, zoom extents and rotate functionality -->
<!-- to the chart and is included for example purposes. -->
<!-- If you wish to know how to zoom and pan a chart then do a search for Zoom Pan in the Examples suite! -->
<ext:SciChartInteractionToolbar TargetSurface="{Binding Source={x:Reference Name=SciChart}}" />
<!-- Create the chart surface -->
<s:SciChartSurface Name="SciChart"
Grid.Column="1"
BorderThickness="0"
ChartTitle="Meat vs. Vegetables"
Padding="0">
<!-- Declare RenderableSeries -->
<s:SciChartSurface.RenderableSeries>
<s:StackedColumnRenderableSeries Fill="#FF226Fb7" StackedGroupId="Meat">
<s:StackedColumnRenderableSeries.SeriesAnimation>
<s:WaveAnimation AnimationDelay="0:0:1" Duration="0:0:3" PointDurationFraction="0.3"/>
</s:StackedColumnRenderableSeries.SeriesAnimation>
</s:StackedColumnRenderableSeries>
<s:StackedColumnRenderableSeries Fill="#ffff9a2e" StackedGroupId="Meat">
<s:StackedColumnRenderableSeries.SeriesAnimation>
<s:WaveAnimation AnimationDelay="0:0:1" Duration="0:0:3" PointDurationFraction="0.3"/>
</s:StackedColumnRenderableSeries.SeriesAnimation>
</s:StackedColumnRenderableSeries>
<s:StackedColumnRenderableSeries Fill="#ffdc443f" StackedGroupId="Vegetables">
<s:StackedColumnRenderableSeries.SeriesAnimation>
<s:WaveAnimation AnimationDelay="0:0:1" Duration="0:0:3" PointDurationFraction="0.3"/>
</s:StackedColumnRenderableSeries.SeriesAnimation>
</s:StackedColumnRenderableSeries>
<s:StackedColumnRenderableSeries Fill="#ffaad34f" StackedGroupId="Vegetables">
<s:StackedColumnRenderableSeries.SeriesAnimation>
<s:WaveAnimation AnimationDelay="0:0:1" Duration="0:0:3" PointDurationFraction="0.3"/>
</s:StackedColumnRenderableSeries.SeriesAnimation>
</s:StackedColumnRenderableSeries>
<s:StackedColumnRenderableSeries Fill="#ff8562b4" StackedGroupId="Vegetables">
<s:StackedColumnRenderableSeries.SeriesAnimation>
<s:WaveAnimation AnimationDelay="0:0:1" Duration="0:0:3" PointDurationFraction="0.3"/>
</s:StackedColumnRenderableSeries.SeriesAnimation>
</s:StackedColumnRenderableSeries>
</s:SciChartSurface.RenderableSeries>
<!-- Create an X Axis -->
<s:SciChartSurface.XAxis>
<s:NumericAxis AutoTicks="False"
MajorDelta="1"
MinorDelta="0.5"
VisibleRangeLimit="1972,2023" />
</s:SciChartSurface.XAxis>
<!-- Create a Y Axis -->
<s:SciChartSurface.YAxis>
<s:NumericAxis DrawMajorBands="True" />
</s:SciChartSurface.YAxis>
<s:SciChartSurface.ChartModifier>
<s:ModifierGroup>
<s:RubberBandXyZoomModifier IsAnimated="False" IsXAxisOnly="True" />
<s:ZoomExtentsModifier IsAnimated="False" />
<s:RolloverModifier ShowTooltipOn="Always" />
<s:LegendModifier Margin="10"
HorizontalAlignment="Center"
VerticalAlignment="Bottom"
GetLegendDataFor="AllSeries"
LegendPlacement="Bottom"
Orientation="Horizontal"
ShowLegend="True"
ShowVisibilityCheckboxes="True" />
</s:ModifierGroup>
</s:SciChartSurface.ChartModifier>
</s:SciChartSurface>
</Grid>
</UserControl>StackedColumnChartExampleView.xaml.cs
View source code// *************************************************************************************
// SCICHART® Copyright SciChart Ltd. 2011-2022. All rights reserved.
//
// Web: http://www.scichart.com
// Support: support@scichart.com
// Sales: sales@scichart.com
//
// StackedColumnChartExampleView.xaml.cs is part of the SCICHART® Examples. Permission is hereby granted
// to modify, create derivative works, distribute and publish any part of this source
// code whether for commercial, private or personal use.
//
// The SCICHART® examples are distributed in the hope that they will be useful, but
// without any warranty. It is provided "AS IS" without warranty of any kind, either
// expressed or implied.
// *************************************************************************************
using System.Windows;
using SciChart.Charting.Model.DataSeries;
namespace SciChart.Examples.Examples.CreateMultiseriesChart
{
/// <summary>
/// Interaction logic for StackedColumnChartExampleView.xaml
/// </summary>
public partial class StackedColumnChartExampleView
{
public StackedColumnChartExampleView()
{
InitializeComponent();
}
private void StackedColumnChartExampleView_OnLoaded(object sender, RoutedEventArgs e)
{
var porkData = new double[] { 10, 13, 7, 16, 4, 6, 20, 14, 16, 10, 24, 11 };
var vealData = new double[] { 12, 17, 21, 15, 19, 18, 13, 21, 22, 20, 5, 10 };
var tomatoesData = new double[] { 7, 30, 27, 24, 21, 15, 17, 26, 22, 28, 21, 22 };
var cucumberData = new double[] { 16, 10, 9, 8, 22, 14, 12, 27, 25, 23, 17, 17 };
var pepperData = new double[] { 7, 24, 21, 11, 19, 17, 14, 27, 26, 22, 28, 16 };
var dataSeries1 = new UniformXyDataSeries<double>(1992d, 1d) { SeriesName = "Pork" };
var dataSeries2 = new UniformXyDataSeries<double>(1992d, 1d) { SeriesName = "Veal" };
var dataSeries3 = new UniformXyDataSeries<double>(1992d, 1d) { SeriesName = "Tomato" };
var dataSeries4 = new UniformXyDataSeries<double>(1992d, 1d) { SeriesName = "Cucumber" };
var dataSeries5 = new UniformXyDataSeries<double>(1992d, 1d) { SeriesName = "Pepper" };
for (int i = 0; i < porkData.Length; i++)
{
dataSeries1.Append(porkData[i]);
dataSeries2.Append(vealData[i]);
dataSeries3.Append(tomatoesData[i]);
dataSeries4.Append(cucumberData[i]);
dataSeries5.Append(pepperData[i]);
}
using (SciChart.SuspendUpdates())
{
SciChart.RenderableSeries[0].DataSeries = dataSeries1;
SciChart.RenderableSeries[1].DataSeries = dataSeries2;
SciChart.RenderableSeries[2].DataSeries = dataSeries3;
SciChart.RenderableSeries[3].DataSeries = dataSeries4;
SciChart.RenderableSeries[4].DataSeries = dataSeries5;
}
SciChart.ZoomExtents();
}
}
}