WPF Chart - Examples
SciChart WPF ships with hundreds of WPF Chart Examples which you can browse, play with, view the source-code and even export each WPF Chart Example to a stand-alone Visual Studio solution. All of this is possible with the new and improved SciChart WPF Examples Suite, which ships as part of the SciChart WPF SDK.
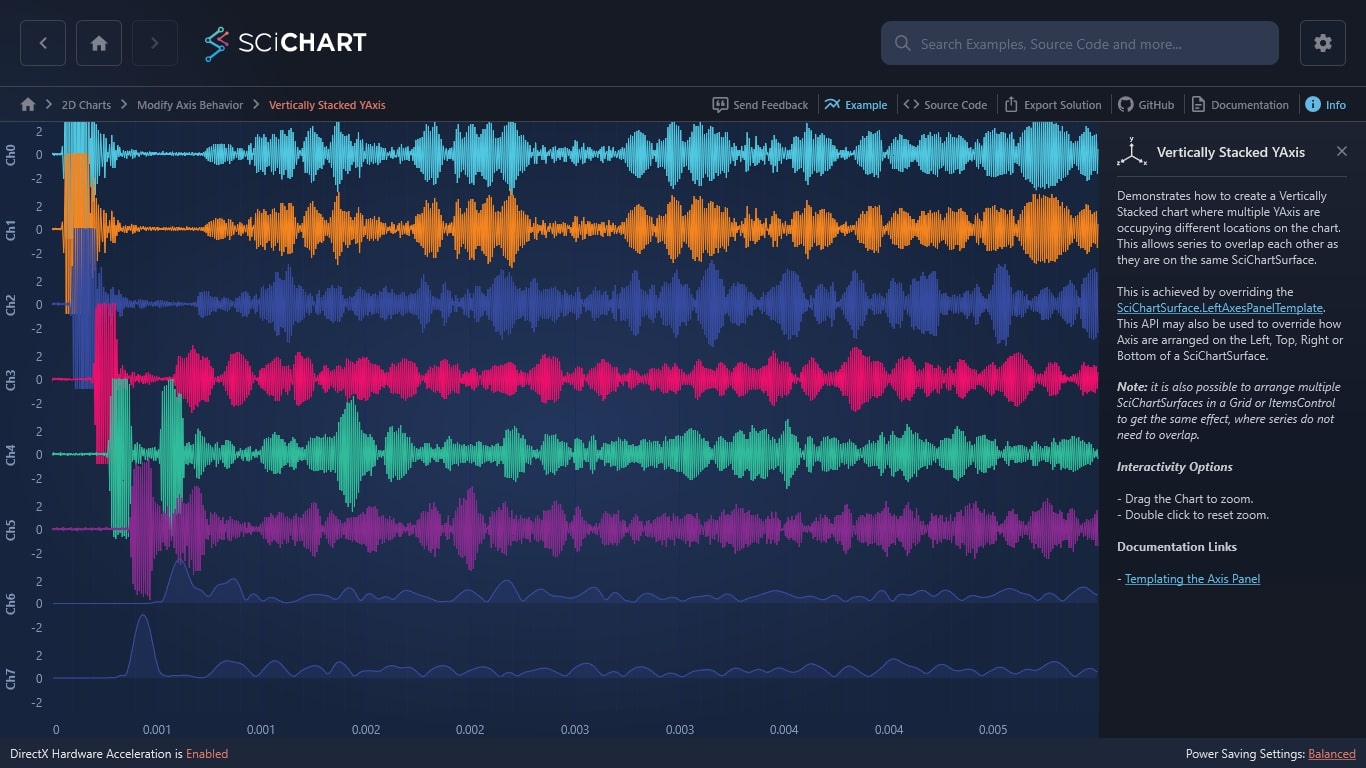
Demonstrates how to create a Vertically Stacked chart where multiple YAxis are occupying different locations on the chart. This allows series to overlap each other as they are on the same SciChartSurface.
This is achieved by overriding the SciChartSurface.LeftAxesPanelTemplate. This API may also be used to override how Axis are arranged on the Left, Top, Right or Bottom of a SciChartSurface.
Note: it is also possible to arrange multiple SciChartSurfaces in a Grid or ItemsControl to get the same effect, where series do not need to overlap.
Interactivity Options
– Drag the Chart to zoom.
– Double click to reset zoom.
Documentation Links

The C#/WPF source code for the WPF Chart Vertically Stacked YAxis example is included below (Scroll down!).
Did you know you can also view the source code from one of the following sources as well?
- Clone the SciChart.WPF.Examples from Github.
- Or, view source in the SciChart WPF Examples suite.
- Also the SciChart WPF Trial contains the full source for the examples (link below).
VerticallyStackedAxes.xaml
View source code<UserControl x:Class="SciChart.Examples.Examples.ModifyAxisBehaviour.VerticallyStackedAxes"
xmlns="http://schemas.microsoft.com/winfx/2006/xaml/presentation"
xmlns:x="http://schemas.microsoft.com/winfx/2006/xaml"
xmlns:d="http://schemas.microsoft.com/expression/blend/2008"
xmlns:mc="http://schemas.openxmlformats.org/markup-compatibility/2006"
xmlns:s="http://schemas.abtsoftware.co.uk/scichart"
d:DesignHeight="400"
d:DesignWidth="600"
mc:Ignorable="d">
<UserControl.Resources>
<Style x:Key="RightAlignedLabelStyle" TargetType="s:DefaultTickLabel">
<Setter Property="HorizontalAnchorPoint" Value="Right" />
</Style>
<Style x:Key="YAxisStyle" TargetType="s:AxisBase">
<Setter Property="HorizontalAlignment" Value="Right" />
<Setter Property="VisibleRange" Value="-2, 2" />
<Setter Property="VisibleRangeLimit" Value="-2, 2" />
<Setter Property="AutoRange" Value="Never" />
<Setter Property="AxisAlignment" Value="Left" />
<Setter Property="DrawMinorGridLines" Value="False" />
<Setter Property="DrawMinorTicks" Value="False" />
<Setter Property="DrawMajorGridLines" Value="False" />
<Setter Property="DrawMajorBands" Value="False" />
<Setter Property="TickLabelStyle" Value="{StaticResource RightAlignedLabelStyle}" />
</Style>
<!-- Optionally replace the default StackPanel for the Axis Container. In this example we create a Grid -->
<!-- with 4x rows and one column. Then use Grid.Row on the actual Axis instances to place in the correct rows -->
<!-- -->
<!-- By Default SciChart will place YAxes stacked horizontally, but using this feature we can override -->
<!-- to place vertically on the same chart surface -->
<ItemsPanelTemplate x:Key="YAxesPanel">
<Grid>
<Grid.RowDefinitions>
<RowDefinition Height="*" />
<RowDefinition Height="10" />
<RowDefinition Height="*" />
<RowDefinition Height="10" />
<RowDefinition Height="*" />
<RowDefinition Height="10" />
<RowDefinition Height="*" />
<RowDefinition Height="10" />
<RowDefinition Height="*" />
<RowDefinition Height="10" />
<RowDefinition Height="*" />
<RowDefinition Height="10" />
<RowDefinition Height="*" />
<RowDefinition Height="10" />
<RowDefinition Height="*" />
</Grid.RowDefinitions>
<Grid.ColumnDefinitions>
<ColumnDefinition Width="Auto" />
</Grid.ColumnDefinitions>
</Grid>
</ItemsPanelTemplate>
<LinearGradientBrush x:Key="MountainFillBrush" StartPoint="0,0" EndPoint="0,1">
<GradientStop Offset="0" Color="#A83376E5" />
<GradientStop Offset="1" Color="#333376E5" />
</LinearGradientBrush>
</UserControl.Resources>
<Grid>
<!-- Create the chart surface -->
<s:SciChartSurface x:Name="sciChart"
LeftAxesPanelTemplate="{StaticResource YAxesPanel}"
RightAxesPanelTemplate="{StaticResource YAxesPanel}">
<!-- Declare RenderableSeries -->
<s:SciChartSurface.RenderableSeries>
<s:FastLineRenderableSeries Stroke="#FFFF1919" YAxisId="Ch0" />
<s:FastLineRenderableSeries Stroke="#FFFC9C29" YAxisId="Ch1" />
<s:FastLineRenderableSeries Stroke="#FFFF1919" YAxisId="Ch2" />
<s:FastLineRenderableSeries Stroke="#FFFC9C29" YAxisId="Ch3" />
<s:FastLineRenderableSeries Stroke="#FF4083B7" YAxisId="Ch4" />
<s:FastLineRenderableSeries Stroke="#FF99EE99" YAxisId="Ch5" />
<s:FastMountainRenderableSeries Fill="{StaticResource MountainFillBrush}"
Stroke="#FF4083B7"
YAxisId="Ch6" />
<s:FastMountainRenderableSeries Fill="{StaticResource MountainFillBrush}"
Stroke="#FF4083B7"
YAxisId="Ch7" />
</s:SciChartSurface.RenderableSeries>
<!-- Create an X Axis with Growby -->
<s:SciChartSurface.XAxis>
<s:NumericAxis />
</s:SciChartSurface.XAxis>
<!-- Create a Y Axis with Grid.Row to position on the YAxis Panel. Alternate axis display MajorGridLines -->
<s:SciChartSurface.YAxes>
<s:NumericAxis x:Name="Ch0"
Grid.Row="0"
AxisTitle="Ch0"
Id="Ch0"
Style="{StaticResource YAxisStyle}" />
<s:NumericAxis x:Name="Ch1"
Grid.Row="2"
AxisTitle="Ch1"
Id="Ch1"
Style="{StaticResource YAxisStyle}" />
<s:NumericAxis x:Name="Ch2"
Grid.Row="4"
AxisTitle="Ch2"
Id="Ch2"
Style="{StaticResource YAxisStyle}" />
<s:NumericAxis x:Name="Ch3"
Grid.Row="6"
AxisTitle="Ch3"
Id="Ch3"
Style="{StaticResource YAxisStyle}" />
<s:NumericAxis x:Name="Ch4"
Grid.Row="8"
AxisTitle="Ch4"
Id="Ch4"
Style="{StaticResource YAxisStyle}" />
<s:NumericAxis x:Name="Ch5"
Grid.Row="10"
AxisTitle="Ch5"
Id="Ch5"
Style="{StaticResource YAxisStyle}" />
<s:NumericAxis x:Name="Ch6"
Grid.Row="12"
AxisTitle="Ch6"
Id="Ch6"
Style="{StaticResource YAxisStyle}" />
<s:NumericAxis x:Name="Ch7"
Grid.Row="14"
AxisTitle="Ch7"
Id="Ch7"
Style="{StaticResource YAxisStyle}" />
</s:SciChartSurface.YAxes>
<s:SciChartSurface.ChartModifier>
<s:ModifierGroup>
<s:RubberBandXyZoomModifier IsXAxisOnly="True" />
<s:ZoomExtentsModifier />
<s:CursorModifier ShowAxisLabels="False" ShowTooltip="False" />
</s:ModifierGroup>
</s:SciChartSurface.ChartModifier>
</s:SciChartSurface>
</Grid>
</UserControl>
VerticallyStackedAxes.xaml.cs
View source code// *************************************************************************************
// SCICHART® Copyright SciChart Ltd. 2011-2022. All rights reserved.
//
// Web: http://www.scichart.com
// Support: support@scichart.com
// Sales: sales@scichart.com
//
// VerticallyStackedAxes.xaml.cs is part of the SCICHART® Examples. Permission is hereby granted
// to modify, create derivative works, distribute and publish any part of this source
// code whether for commercial, private or personal use.
//
// The SCICHART® examples are distributed in the hope that they will be useful, but
// without any warranty. It is provided "AS IS" without warranty of any kind, either
// expressed or implied.
// *************************************************************************************
using System;
using System.Collections.Generic;
using System.Threading.Tasks;
using System.Windows;
using System.Windows.Controls;
using SciChart.Charting.Model.DataSeries;
using SciChart.Examples.ExternalDependencies.Data;
namespace SciChart.Examples.Examples.ModifyAxisBehaviour
{
/// <summary>
/// Interaction logic for VerticallyStackedAxes.xaml
/// </summary>
public partial class VerticallyStackedAxes : UserControl
{
public VerticallyStackedAxes()
{
InitializeComponent();
Loaded += OnLoaded;
}
private void OnLoaded(object sender, RoutedEventArgs e)
{
Task.Factory.StartNew(() =>
{
// Creates 8 dataseries with data on a background thread
var dataSeries = new List<IDataSeries>();
for (int i = 0; i < 8; i++)
{
var ds = new XyDataSeries<double, double>();
dataSeries.Add(ds);
var someData = DataManager.Instance.GetAcousticChannel(i);
ds.Append(someData.XData, someData.YData);
}
// Creates 8 renderable series on the UI thread
Dispatcher.BeginInvoke(new Action(() => CreateRenderableSeries(dataSeries)));
});
}
private void CreateRenderableSeries(List<IDataSeries> result)
{
// Batch updates with one redraw
using (sciChart.SuspendUpdates())
{
for (int i = 0; i < 8; i++)
{
sciChart.RenderableSeries[i].DataSeries = result[i];
}
}
}
}
}