WPF Chart - Examples
SciChart WPF ships with hundreds of WPF Chart Examples which you can browse, play with, view the source-code and even export each WPF Chart Example to a stand-alone Visual Studio solution. All of this is possible with the new and improved SciChart WPF Examples Suite, which ships as part of the SciChart WPF SDK.
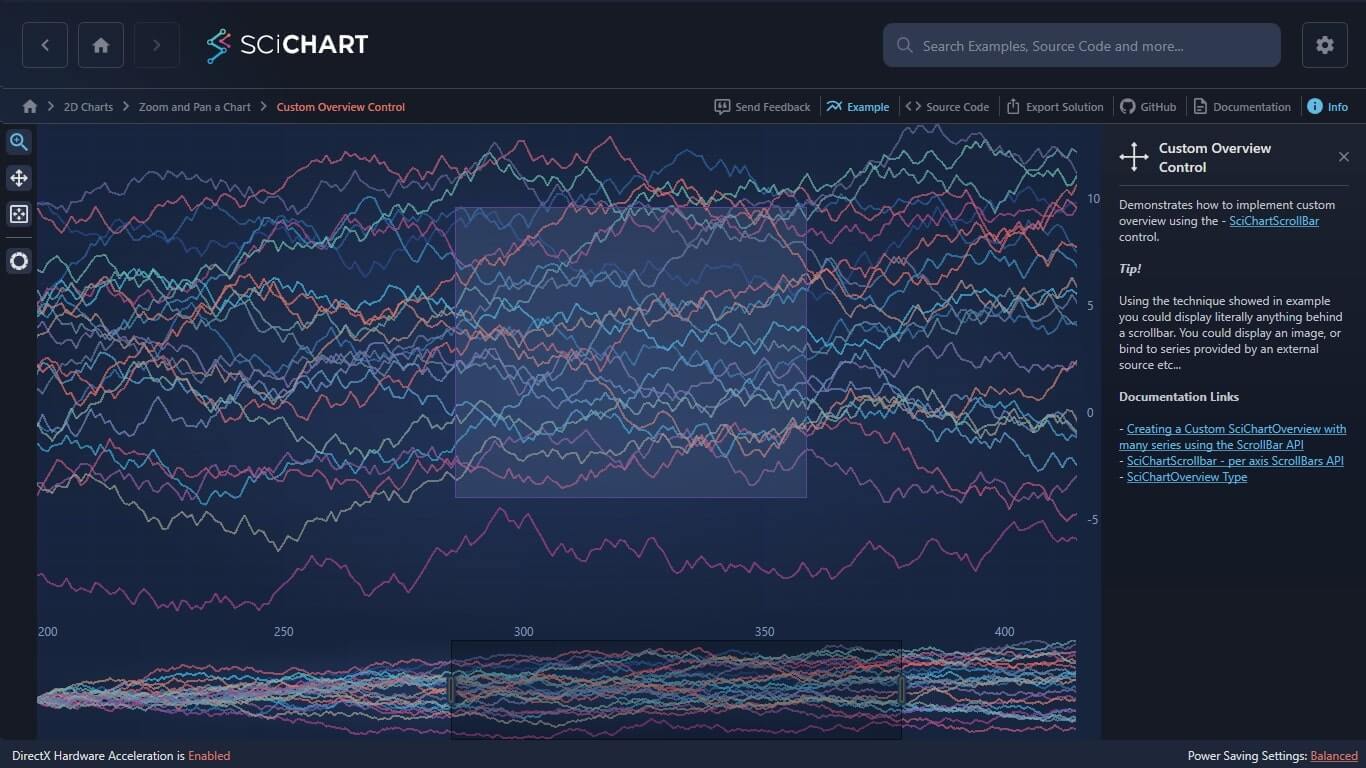
Demonstrates how to implement custom overview using the – SciChartScrollBar control.
Tip!
Using the technique showed in example you could display literally anything behind a scrollbar. You could display an image, or bind to series provided by an external source etc…
Documentation Links
– Creating a Custom SciChartOverview with many series using the ScrollBar API
– SciChartScrollbar – per axis ScrollBars API
– SciChartOverview Type

The C#/WPF source code for the WPF Custom Overview Control example is included below (Scroll down!).
Did you know you can also view the source code from one of the following sources as well?
- Clone the SciChart.WPF.Examples from Github.
- Or, view source in the SciChart WPF Examples suite.
- Also the SciChart WPF Trial contains the full source for the examples (link below).
CustomOverviewView.xaml
View source code<UserControl x:Class="SciChart.Examples.Examples.ZoomAndPanAChart.CustomOverview.CustomOverviewView"
xmlns="http://schemas.microsoft.com/winfx/2006/xaml/presentation"
xmlns:x="http://schemas.microsoft.com/winfx/2006/xaml"
xmlns:d="http://schemas.microsoft.com/expression/blend/2008"
xmlns:ext="http://schemas.abtsoftware.co.uk/scichart/exampleExternals"
xmlns:mc="http://schemas.openxmlformats.org/markup-compatibility/2006"
xmlns:s="http://schemas.abtsoftware.co.uk/scichart"
d:DesignHeight="400"
d:DesignWidth="600"
mc:Ignorable="d">
<UserControl.Resources>
<Style TargetType="s:SciChartScrollbar">
<Setter Property="GripsThickness" Value="9" />
<Setter Property="GripsLength" Value="30" />
<Setter Property="Background" Value="Transparent"/>
<Setter Property="ViewportStyle">
<Setter.Value>
<Style TargetType="Control">
<Setter Property="Background" Value="#33000000" />
<Setter Property="BorderBrush" Value="#99000000" />
</Style>
</Setter.Value>
</Setter>
<Setter Property="GripsStyle">
<Setter.Value>
<Style TargetType="Control">
<Setter Property="Background" Value="#535353" />
<Setter Property="BorderThickness" Value="2" />
</Style>
</Setter.Value>
</Setter>
</Style>
<ext:DoubleToGridLengthConverter x:Key="DoubleToGridLengthConverter" />
</UserControl.Resources>
<Grid Background="{Binding Source={x:Reference Name=MainChartSurface}, Path=Background}">
<Grid.ColumnDefinitions>
<ColumnDefinition Width="Auto" />
<ColumnDefinition Width="*" />
</Grid.ColumnDefinitions>
<Grid.RowDefinitions>
<RowDefinition Height="*" />
<RowDefinition Height="Auto" />
</Grid.RowDefinitions>
<!-- The SciChartInteractionToolbar adds zoom, pan, zoom extents and rotate functionality -->
<!-- to the chart and is included for example purposes. -->
<!-- If you wish to know how to zoom and pan a chart then do a search for Zoom Pan in the Examples suite! -->
<ext:SciChartInteractionToolbar TargetSurface="{Binding Source={x:Reference Name=MainChartSurface}}" Grid.RowSpan="2" />
<s:SciChartSurface x:Name="MainChartSurface"
Grid.Column="1"
RenderableSeries="{s:SeriesBinding RenderableSeriesViewModels}">
<s:SciChartSurface.XAxis>
<s:NumericAxis x:Name="XAxis"
DrawMinorGridLines="True"
DrawMinorTicks="True"
VisibleRange="50,300" />
</s:SciChartSurface.XAxis>
<s:SciChartSurface.YAxis>
<s:NumericAxis DrawMinorGridLines="True" DrawMinorTicks="True" />
</s:SciChartSurface.YAxis>
</s:SciChartSurface>
<!-- This grid is used to space Overview Control so its width matches parent chart XAxis -->
<Grid Grid.Row="1" Grid.Column="1">
<!-- The grid is used to set paddings around the Overview, so that the size of the Overview matches the size of the XAxis on the parent chart -->
<Grid.ColumnDefinitions>
<ColumnDefinition Width="*" />
<!-- Hosts overview control -->
<ColumnDefinition Width="{Binding Source={x:Reference Name=proxy}, Path=ActualWidthValue, Mode=OneWay, Converter={StaticResource DoubleToGridLengthConverter}}" />
<!-- Used to bind to parent surface YAxis -->
</Grid.ColumnDefinitions>
<!-- This class is in the Examples Source Code, under your install directory -->
<ext:ActualSizePropertyProxy x:Name="proxy" Element="{Binding Source={x:Reference Name=MainChartSurface}, Path=YAxis}" />
<!-- Define the SciChartSurface behind the scrollbar -->
<s:SciChartSurface x:Name="OverviewSurface"
Grid.Column="0"
Loaded="OnOverviewSurfaceLoaded"
RenderableSeries="{s:SeriesBinding RenderableSeriesViewModels}">
<s:SciChartSurface.XAxis>
<s:NumericAxis DrawMajorGridLines="False"
DrawMinorGridLines="False"
Visibility="Collapsed" />
</s:SciChartSurface.XAxis>
<s:SciChartSurface.YAxis>
<s:NumericAxis DrawMajorGridLines="False"
DrawMinorGridLines="False"
Visibility="Collapsed" />
</s:SciChartSurface.YAxis>
</s:SciChartSurface>
<!-- Define the scrollbar and bind to MainChartSurface XAxis -->
<s:SciChartScrollbar Grid.Column="0"
Height="100"
Margin="{Binding Source={x:Reference Name=MainChartSurface}, Path=Padding, Mode=OneWay}"
Axis="{Binding Source={x:Reference Name=XAxis}}" />
</Grid>
</Grid>
</UserControl>
CustomOverviewView.xaml.cs
View source code// *************************************************************************************
// SCICHART® Copyright SciChart Ltd. 2011-2022. All rights reserved.
//
// Web: http://www.scichart.com
// Support: support@scichart.com
// Sales: sales@scichart.com
//
// CustomOverviewView.xaml.cs is part of the SCICHART® Examples. Permission is hereby granted
// to modify, create derivative works, distribute and publish any part of this source
// code whether for commercial, private or personal use.
//
// The SCICHART® examples are distributed in the hope that they will be useful, but
// without any warranty. It is provided "AS IS" without warranty of any kind, either
// expressed or implied.
// *************************************************************************************
using System.Windows;
using System.Windows.Controls;
namespace SciChart.Examples.Examples.ZoomAndPanAChart.CustomOverview
{
/// <summary>
/// Interaction logic for CustomOverview.xaml
/// </summary>
public partial class CustomOverviewView : UserControl
{
public CustomOverviewView()
{
InitializeComponent();
}
private void OnOverviewSurfaceLoaded(object sender, RoutedEventArgs e)
{
OverviewSurface.ZoomExtents();
}
}
}CustomOverviewViewModel.cs
View source code// *************************************************************************************
// SCICHART® Copyright SciChart Ltd. 2011-2022. All rights reserved.
//
// Web: http://www.scichart.com
// Support: support@scichart.com
// Sales: sales@scichart.com
//
// CustomOverviewViewModel.cs is part of the SCICHART® Examples. Permission is hereby granted
// to modify, create derivative works, distribute and publish any part of this source
// code whether for commercial, private or personal use.
//
// The SCICHART® examples are distributed in the hope that they will be useful, but
// without any warranty. It is provided "AS IS" without warranty of any kind, either
// expressed or implied.
// *************************************************************************************
using System;
using System.Collections.ObjectModel;
using System.Windows.Media;
using SciChart.Charting.Model.ChartSeries;
using SciChart.Charting.Model.DataSeries;
using SciChart.Examples.ExternalDependencies.Common;
using SciChart.Examples.ExternalDependencies.Data;
namespace SciChart.Examples.Examples.ZoomAndPanAChart.CustomOverview
{
public class CustomOverviewViewModel: BaseViewModel
{
private const int SeriesCount = 25;
private const int PointCount = 500;
public CustomOverviewViewModel()
{
Initialize();
}
private void Initialize()
{
RenderableSeriesViewModels = new ObservableCollection<IRenderableSeriesViewModel>();
var random = new Random(0);
var generator = new RandomWalkGenerator();
for (int i = 0; i < SeriesCount; i++)
{
var dataSeries = new UniformXyDataSeries<double>();
var someData = generator.GetRandomWalkYData(PointCount);
generator.Reset();
dataSeries.Append(someData);
var rgb = new byte[3];
random.NextBytes(rgb);
RenderableSeriesViewModels.Add(new LineRenderableSeriesViewModel
{
DataSeries = dataSeries,
AntiAliasing = false,
Stroke = Color.FromArgb(255, rgb[0], rgb[1], rgb[2])
});
}
}
public ObservableCollection<IRenderableSeriesViewModel> RenderableSeriesViewModels { get; set; }
}
}