
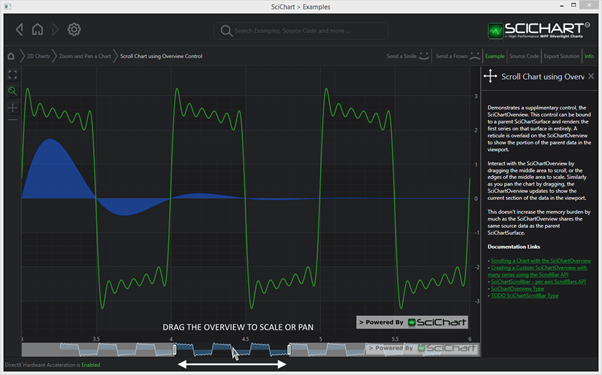
SciChart features a special scrollbar type, which displays a SciChartSurface behind it, called the SciChartOverview. The SciChartOverview can be applied to the XAxis only and displays a single series from the parent chart.
Declaring a SciChartOverview in XAML
| Declaring a SciChartOverview |
Copy Code |
|---|---|
<Grid> <Grid.RowDefinitions> <RowDefinition Height="*"/> <RowDefinition Height="32"/> </Grid.RowDefinitions> <s:SciChartSurface x:Name="sciChartSurface"> <s:SciChartSurface.RenderableSeries> <s:FastLineRenderableSeries Style="{StaticResource LineSeriesStyle0}"/> </s:SciChartSurface.RenderableSeries> <s:SciChartSurface.XAxis> <s:NumericAxis/> </s:SciChartSurface.XAxis> <s:SciChartSurface.YAxis> <s:NumericAxis/> </s:SciChartSurface.YAxis> </s:SciChartSurface> <s:SciChartOverview Grid.Row="1" ParentSurface="{Binding ElementName=sciChartSurface}" DataSeries="{Binding ElementName=sciChartSurface, Path=RenderableSeries[0].DataSeries}" SelectedRange="{Binding ElementName=sciChartSurface, Path=XAxis.VisibleRange, Mode=TwoWay}"/> </Grid> | |
Declaring a SciChartOverview in Code
We don’t recommend declaring an overview in code, as it requires creating a binding in code, but here is how to do it just in case you need to.
| Declaring a SciChartOverview |
Copy Code |
|---|---|
// Declare a SciChartSurface with X,Y Axis and one series var sciChartSurface = new SciChartSurface(); sciChartSurface.XAxis = new NumericAxis(); sciChartSurface.YAxis = new NumericAxis(); var xyData = new XyDataSeries<double,double>(); sciChartSurface.RenderableSeries.Add(new FastLineRenderableSeries() { DataSeries = xyData }); // Declare a SciChartOverview var sciChartOverview = new SciChartOverview(); sciChartOverview.ParentSurface = sciChartSurface; sciChartOverview.DataSeries = xyData; // Bind SciChartOverview.SelectedRange to the XAxis.VisibleRange Binding visibleRangeBinding = new Binding("VisibleRange"); visibleRangeBinding.Source = (AxisBase)sciChartSurface.XAxis; visibleRangeBinding.Mode = BindingMode.TwoWay; BindingOperations.SetBinding(sciChartOverview, SciChartOverview.SelectedRangeProperty, visibleRangeBinding); | |
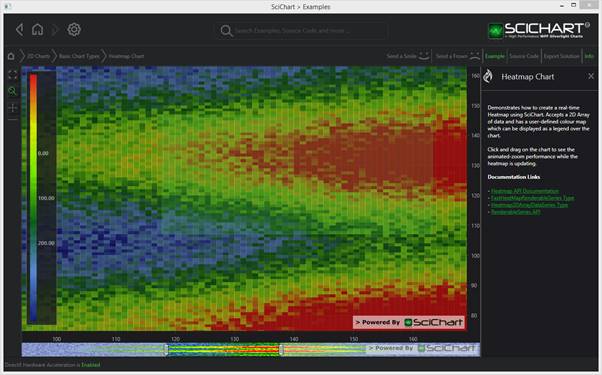
Changing the RenderableSeriesType / RenderableSeriesStyle Behind the SciChartOverview
By default, the SciChartOverview displays a FastMountainRenderableSeries with default theme colors. You can change this to show any RenderableSeries type. Also, you can apply a style to the series. For instance, here is the SciChartOverview bound to a chart with a FastHeatmapRenderableSeries, showing a live heatmap background:
This is achieved with the following code:
| Changing the RenderableSeriesType / RenderableSeriesStyle Behind the SciChartOverview |
Copy Code |
|---|---|
<Grid> <Grid.RowDefinitions> <RowDefinition Height="*"/> <RowDefinition Height="32"/> </Grid.RowDefinitions> <s:SciChartSurface x:Name="sciChartSurface"> <s:SciChartSurface.RenderableSeries> <s:FastHeatMapRenderableSeries x:Name="heatmapSeries" Opacity="0.5" Maximum="200"> <s:FastHeatMapRenderableSeries.ColorMap> <LinearGradientBrush> <GradientStop Offset="0" Color="DarkBlue" /> <GradientStop Offset="0.2" Color="CornflowerBlue" /> <GradientStop Offset="0.4" Color="DarkGreen" /> <GradientStop Offset="0.6" Color="Chartreuse" /> <GradientStop Offset="0.8" Color="Yellow" /> <GradientStop Offset="1" Color="Red" /> </LinearGradientBrush> </s:FastHeatMapRenderableSeries.ColorMap> </s:FastHeatMapRenderableSeries> </s:SciChartSurface.RenderableSeries> <s:SciChartSurface.XAxis> <s:NumericAxis DrawMajorBands="True" /> </s:SciChartSurface.XAxis> <s:SciChartSurface.YAxis> <s:NumericAxis DrawMajorBands="True" /> </s:SciChartSurface.YAxis> </s:SciChartSurface> <s:SciChartOverview Grid.Row="1" ParentSurface="{Binding ElementName=sciChartSurface}" SelectedRange="{Binding ElementName=sciChartSurface, Path=XAxis.VisibleRange, Mode=TwoWay}" RenderableSeriesType="{x:Type s:FastHeatMapRenderableSeries}"> <s:SciChartOverview.RenderableSeriesStyle> <Style TargetType="{x:Type s:FastHeatMapRenderableSeries}"> <Setter Property="ColorMap" Value="{Binding ElementName=heatmapSeries, Path=ColorMap}"/> <Setter Property="Maximum" Value="{Binding ElementName=heatmapSeries, Path=Maximum}"/> <Setter Property="DataSeries" Value="{Binding ElementName=heatmapSeries, Path=DataSeries}"/> </Style> </s:SciChartOverview.RenderableSeriesStyle> </s:SciChartOverview> </Grid> | |
NOTE: The TargetType of the style applied to SciChartOverview.RenderableSeriesStyle must match the SciChartSurface.RenderableSeriesType. The default type is FastMountainRenderableSeries.
Getting a Notification of SciChartOverview Scrolled
We advise subscribing to AxisBase.VisibleRangeChanged on the ParentSurface.XAxis itself, as this will be fired whenever the range changes.
Alternatively, you can create your own custom Overview using the SciChartScrollbar API and subscribe to the SelectedRangeChanged event.
Styling the SciChartOverview
The SciChartOverview now uses the SciChartScrollbar API at it’s core. You can style the SciChartOverview’s Scrollbar element directly by changing the SciChartOverview.ScrollbarStyle property.
| Styling the SciChartOverview |
Copy Code |
|---|---|
<!-- SciChartOverviewControl Style hosted in resource dictionary --> <UserControl.Resources> <Style x:Key="OverviewScrollbarStyle" TargetType="visuals:SciChartScrollbar"> <Setter Property="Orientation" Value="Horizontal" /> <Setter Property="GripsLength" Value="25" /> <Setter Property="ViewportStyle"> <Setter.Value> <Style TargetType="Control"> <Setter Property="Opacity" Value="0" /> </Style> </Setter.Value> </Setter> <Setter Property="NonSelectedAreaStyle"> <Setter.Value> <Style TargetType="Path"> <Setter Property="Fill" Value="{z:ThemeBinding Path=OverviewFill}" /> </Style> </Setter.Value> </Setter> </Style> </UserControl.Resources> <s:SciChartOverview ScrollbarStyle="{StaticResource OverviewScrollbarStyle}"/> | |
You can also set the following properties, which allow changing the some basic brushes in the SciChartOverview:
- Background, Foreground
- Fill (for the default mountain series), Stroke (for the default mountain series)
- Padding
Templating the SciChartOverview
The Control Template for the SciChartOverview is defined as follows:
| Templating the SciChartOverview |
Copy Code |
|---|---|
<ControlTemplate TargetType="visuals:SciChartOverview"> <Grid Name="PART_Container"> <s:SciChartSurface x:Name="PART_BackgroundSurface" Background="{TemplateBinding Background}" BorderThickness="0" FontSize="{TemplateBinding FontSize}" FontWeight="{TemplateBinding FontWeight}" Foreground="{TemplateBinding Foreground}" Padding="{TemplateBinding Padding}"> <s:SciChartSurface.RenderableSeries> <s:FastMountainRenderableSeries Fill="{TemplateBinding Fill}" DataSeries="{TemplateBinding DataSeries}" Stroke="{TemplateBinding Stroke}" /> </s:SciChartSurface.RenderableSeries> <s:SciChartSurface.YAxis> <s:NumericAxis AutoRange="Always" DrawMajorGridLines="False" DrawMinorGridLines="False" TextFormatting="###E+0" Visibility="Collapsed" Growby="0, 0.1"> </s:NumericAxis> </s:SciChartSurface.YAxis> </s:SciChartSurface> <s:SciChartScrollbar x:Name="PART_Scrollbar" Axis="{TemplateBinding Axis}" Style="{TemplateBinding ScrollbarStyle}" /> </Grid> </ControlTemplate> | |
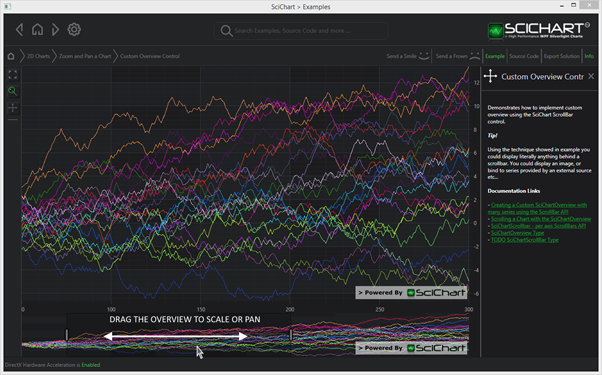
How to: Create a Custom SciChartOverview with any Background
The SciChartOverview only supports a single series behind it, and does not allow a custom background. You can however use the SciChartScrollbar API to create a custom overview.
| Create a Custom SciChartOverview with any Background |
Copy Code |
|---|---|
<Grid Background="{Binding ElementName=MainChartSurface, Path=Background}"> <Grid.RowDefinitions> <RowDefinition Height="*" /> <RowDefinition Height="100" /> </Grid.RowDefinitions> <!-- Define a SciChartSurface --> <s:SciChartSurface x:Name="MainChartSurface"> <!-- XAxis, YAxis, RenderableSeries omitted for brevity --> </s:SciChartSurface> <!-- Define a SciChartScrollbar with a custom background --> <Grid Grid.Row="1" > <!-- PLACE YOUR CUSTOM BACKGROUND HERE --> <!-- Define the scrollbar and bind to MainChartSurface XAxis --> <s:SciChartScrollbar Grid.Column="0" Axis="{Binding ElementName=MainChartSurface, Path=XAxis}" /> </Grid> </Grid> | |