WPF Chart - Examples
SciChart WPF ships with hundreds of WPF Chart Examples which you can browse, play with, view the source-code and even export each WPF Chart Example to a stand-alone Visual Studio solution. All of this is possible with the new and improved SciChart WPF Examples Suite, which ships as part of the SciChart WPF SDK.
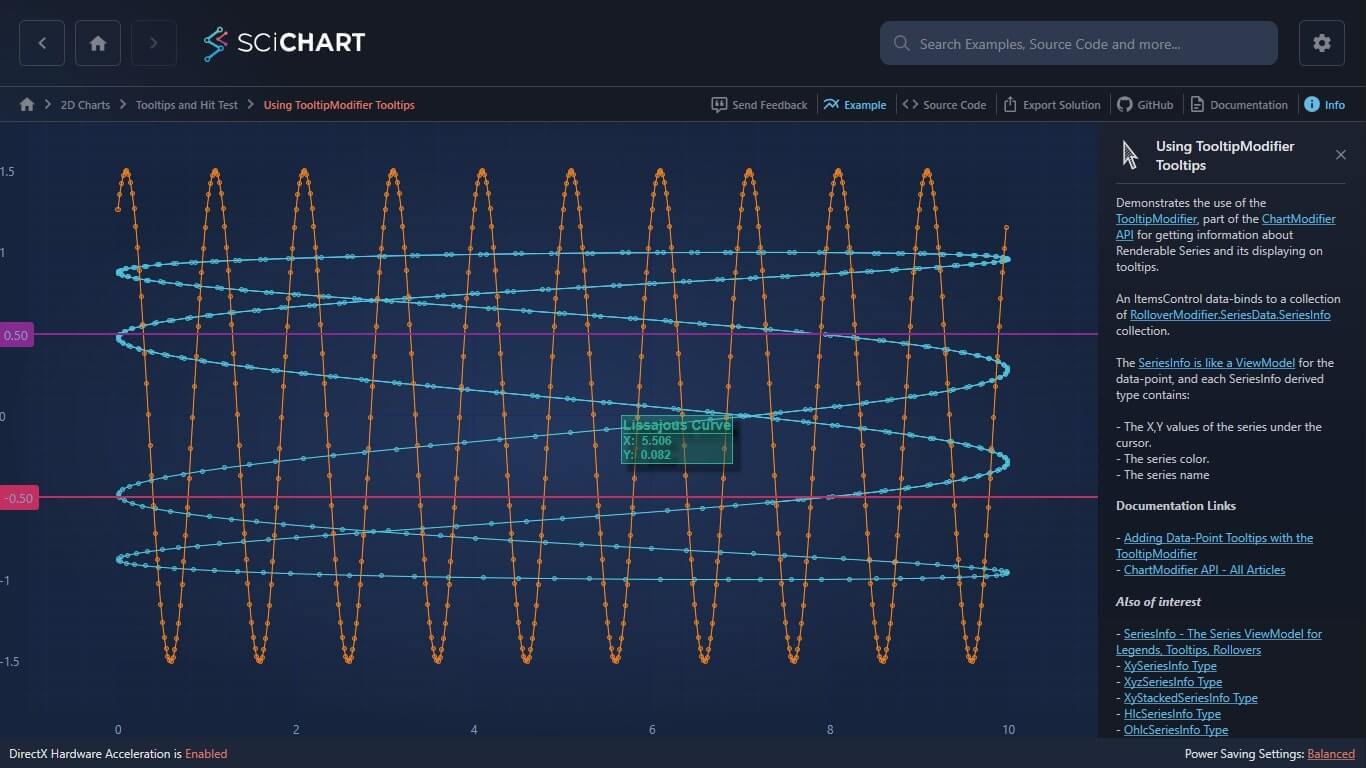
This example demonstrates the CursorModifier: a ChartModifier derived type which adds a cross-hairs (cursor) to the chart, as well as displaying an aggregated tooltip for all series.
The Tooltip may be templated to display custom data, or configured to show only on mouse-over of a series, or always. It is also possible to show/hide Axis Labels, Show/Hide the crosshairs and style the Crosshairs lines.
Alternative modifiers for displaying Tooltips include the TooltipModifier, the RolloverModifier and the VerticalSliceModifier.
Documentation Links

The C#/WPF source code for the WPF Chart Using CursorModifier Tooltips example is included below (Scroll down!).
Did you know you can also view the source code from one of the following sources as well?
- Clone the SciChart.WPF.Examples from Github.
- Or, view source in the SciChart WPF Examples suite.
- Also the SciChart WPF Trial contains the full source for the examples (link below).
CursorModifierExampleView.xaml
View source code<UserControl x:Class="SciChart.Examples.Examples.InspectDatapoints.CursorModifierExampleView"
xmlns="http://schemas.microsoft.com/winfx/2006/xaml/presentation"
xmlns:x="http://schemas.microsoft.com/winfx/2006/xaml"
xmlns:d="http://schemas.microsoft.com/expression/blend/2008"
xmlns:ext="http://schemas.abtsoftware.co.uk/scichart/exampleExternals"
xmlns:mc="http://schemas.openxmlformats.org/markup-compatibility/2006"
xmlns:s="http://schemas.abtsoftware.co.uk/scichart"
d:DesignHeight="400"
d:DesignWidth="600"
mc:Ignorable="d">
<UserControl.Resources>
<ResourceDictionary>
<ResourceDictionary.MergedDictionaries>
<ResourceDictionary Source="/SciChart.Examples.ExternalDependencies;component/Resources/Styles/ToolbarButtonsCommon.xaml" />
</ResourceDictionary.MergedDictionaries>
<DataTemplate x:Key="SeriesInfoTemplate" DataType="s:SeriesInfo">
<StackPanel Margin="0 1" Orientation="Vertical">
<TextBlock Text="{Binding SeriesName, StringFormat='{}{0}:'}"/>
<TextBlock Text="{Binding FormattedYValue, StringFormat='Y: {0}'}" />
</StackPanel>
</DataTemplate>
<!-- Demonstrates a custom cursor tooltip style -->
<Style x:Key="CursorTooltipStyle" TargetType="s:CursorLabelControl">
<Setter Property="Template">
<Setter.Value>
<ControlTemplate TargetType="s:CursorLabelControl">
<Border Background="#AAFF6600"
BorderBrush="#FFFF6600"
BorderThickness="2"
Opacity="0.7"
Padding="2.5">
<ItemsControl ItemsSource="{Binding DataContext.SeriesData.SeriesInfo, RelativeSource={RelativeSource TemplatedParent}}">
<ItemsControl.ItemTemplate>
<DataTemplate DataType="s:SeriesInfo">
<ContentControl Content="{Binding}" ContentTemplate="{StaticResource SeriesInfoTemplate}" />
</DataTemplate>
</ItemsControl.ItemTemplate>
</ItemsControl>
</Border>
</ControlTemplate>
</Setter.Value>
</Setter>
</Style>
<!-- Demonstrates custom cursor line style -->
<Style x:Key="CursorLineStyle" TargetType="Line">
<Setter Property="StrokeThickness" Value="2" />
<Setter Property="Stroke" Value="#AAFF6600" />
</Style>
<!-- Label used in cursors -->
<Style x:Key="HintDataItemsStyle" TargetType="TextBlock">
<Setter Property="Foreground" Value="#FFF" />
<Setter Property="FontWeight" Value="Thin" />
<Setter Property="FontFamily" Value="Arial" />
<Setter Property="FontSize" Value="11" />
<Setter Property="Margin" Value="2 1" />
</Style>
<!-- Demonstrates custom axis label style -->
<Style x:Key="CursorModAxisLabelStyle" TargetType="s:AxisLabelControl">
<Setter Property="Background" Value="#AAFF6600" />
<Setter Property="BorderBrush" Value="#FFFF6600" />
<Setter Property="BorderThickness" Value="1" />
</Style>
<DataTemplate x:Key="CursorModAxisLabelTemplate" DataType="s:AxisInfo">
<StackPanel>
<TextBlock Style="{StaticResource HintDataItemsStyle}" Text="{Binding DataValue, StringFormat='{}{0:0.00}'}" />
</StackPanel>
</DataTemplate>
</ResourceDictionary>
</UserControl.Resources>
<Grid>
<Grid.ColumnDefinitions>
<ColumnDefinition Width="Auto" />
<ColumnDefinition Width="*" />
</Grid.ColumnDefinitions>
<ext:SciChartInteractionToolbar Grid.RowSpan="2" TargetSurface="{Binding Source={x:Reference Name=sciChartSurface}}" />
<s:SciChartSurface x:Name="sciChartSurface" Grid.Column="1">
<!-- Declare line RenderableSeries -->
<s:SciChartSurface.RenderableSeries>
<s:FastLineRenderableSeries Stroke="#FF177B17" StrokeThickness="2">
<s:FastLineRenderableSeries.SeriesAnimation>
<s:SweepAnimation AnimationDelay="0:0:1" Duration="0:0:3"/>
</s:FastLineRenderableSeries.SeriesAnimation>
</s:FastLineRenderableSeries>
<s:FastLineRenderableSeries Stroke="#FFDD0909"
StrokeThickness="3"
s:CursorModifier.SnapToSeries="True">
<s:FastLineRenderableSeries.SeriesAnimation>
<s:SweepAnimation AnimationDelay="0:0:1" Duration="0:0:3"/>
</s:FastLineRenderableSeries.SeriesAnimation>
</s:FastLineRenderableSeries>
<s:FastLineRenderableSeries Stroke="Gray" StrokeThickness="5">
<s:FastLineRenderableSeries.SeriesAnimation>
<s:SweepAnimation AnimationDelay="0:0:1" Duration="0:0:3"/>
</s:FastLineRenderableSeries.SeriesAnimation>
</s:FastLineRenderableSeries>
<s:FastLineRenderableSeries IsVisible="False"
Stroke="Gold"
StrokeThickness="2">
<s:FastLineRenderableSeries.SeriesAnimation>
<s:SweepAnimation AnimationDelay="0:0:1" Duration="0:0:3"/>
</s:FastLineRenderableSeries.SeriesAnimation>
</s:FastLineRenderableSeries>
</s:SciChartSurface.RenderableSeries>
<!-- Declare Axes -->
<s:SciChartSurface.XAxis>
<s:NumericAxis s:CursorModifier.AxisLabelContainerStyle="{StaticResource CursorModAxisLabelStyle}" s:CursorModifier.AxisLabelTemplate="{StaticResource CursorModAxisLabelTemplate}" />
</s:SciChartSurface.XAxis>
<s:SciChartSurface.YAxis>
<s:NumericAxis AxisAlignment="Right"
GrowBy="0, 0.1"
s:CursorModifier.AxisLabelContainerStyle="{StaticResource CursorModAxisLabelStyle}"
s:CursorModifier.AxisLabelTemplate="{StaticResource CursorModAxisLabelTemplate}" />
</s:SciChartSurface.YAxis>
<s:SciChartSurface.ChartModifier>
<s:ModifierGroup>
<s:CursorModifier x:Name="CursorModifier"
LineOverlayStyle="{StaticResource CursorLineStyle}"
ShowAxisLabels="True"
ShowTooltip="True"
ShowTooltipOn="MouseOver"
SourceMode="AllSeries"
TooltipContainerStyle="{StaticResource CursorTooltipStyle}"
UseInterpolation="True"
ReceiveHandledEvents="True" />
<!-- Provides selection of series and custom styling to the selected series -->
<s:SeriesSelectionModifier>
<s:SeriesSelectionModifier.SelectedSeriesStyle>
<!-- When a series is selected (on click), apply this style -->
<!-- Changes Stroke to white on click -->
<!-- Applies a PointMarker on click -->
<Style TargetType="s:BaseRenderableSeries">
<Setter Property="PointMarkerTemplate">
<Setter.Value>
<ControlTemplate>
<s:EllipsePointMarker Width="6"
Height="6"
Fill="White" />
</ControlTemplate>
</Setter.Value>
</Setter>
</Style>
</s:SeriesSelectionModifier.SelectedSeriesStyle>
</s:SeriesSelectionModifier>
</s:ModifierGroup>
</s:SciChartSurface.ChartModifier>
</s:SciChartSurface>
</Grid>
</UserControl>
CursorModifierExampleView.xaml.cs
View source code// *************************************************************************************
// SCICHART® Copyright SciChart Ltd. 2011-2022. All rights reserved.
//
// Web: http://www.scichart.com
// Support: support@scichart.com
// Sales: sales@scichart.com
//
// CursorModifierExampleView.xaml.cs is part of the SCICHART® Examples. Permission is hereby granted
// to modify, create derivative works, distribute and publish any part of this source
// code whether for commercial, private or personal use.
//
// The SCICHART® examples are distributed in the hope that they will be useful, but
// without any warranty. It is provided "AS IS" without warranty of any kind, either
// expressed or implied.
// *************************************************************************************
using System.Windows.Controls;
using SciChart.Charting.Model.DataSeries;
using SciChart.Data.Model;
using SciChart.Examples.ExternalDependencies.Data;
namespace SciChart.Examples.Examples.InspectDatapoints
{
/// <summary>
/// Interaction logic for CursorModifierExampleView.xaml
/// </summary>
public partial class CursorModifierExampleView : UserControl
{
public CursorModifierExampleView()
{
InitializeComponent();
var dataSeries0 = new XyDataSeries<double, double>() { SeriesName = "Green Series" };
var dataSeries1 = new XyDataSeries<double, double>() { SeriesName = "Red Series" };
var dataSeries2 = new XyDataSeries<double, double>() { SeriesName = "Gray Series" };
var dataSeries3 = new XyDataSeries<double, double>() { SeriesName = "Yellow Series" };
var data1 = DataManager.Instance.GetNoisySinewave(300, 1.0, 300, 0.25);
var data2 = DataManager.Instance.GetSinewave(100, 2, 300);
var data3 = DataManager.Instance.GetSinewave(200, 1.5, 300);
var data4 = DataManager.Instance.GetSinewave(50, 0.1, 300);
// Append data to series.
dataSeries0.Append(data1.XData, data1.YData);
dataSeries1.Append(data2.XData, data2.YData);
dataSeries2.Append(data3.XData, data3.YData);
dataSeries3.Append(data4.XData, data4.YData);
// Assign DataSeries to RenderableSeries
sciChartSurface.RenderableSeries[0].DataSeries = dataSeries0;
sciChartSurface.RenderableSeries[1].DataSeries = dataSeries1;
sciChartSurface.RenderableSeries[2].DataSeries = dataSeries2;
sciChartSurface.RenderableSeries[3].DataSeries = dataSeries3;
sciChartSurface.XAxis.VisibleRange = new DoubleRange(3, 6);
}
}
}