WPF Chart - Examples
SciChart WPF ships with hundreds of WPF Chart Examples which you can browse, play with, view the source-code and even export each WPF Chart Example to a stand-alone Visual Studio solution. All of this is possible with the new and improved SciChart WPF Examples Suite, which ships as part of the SciChart WPF SDK.
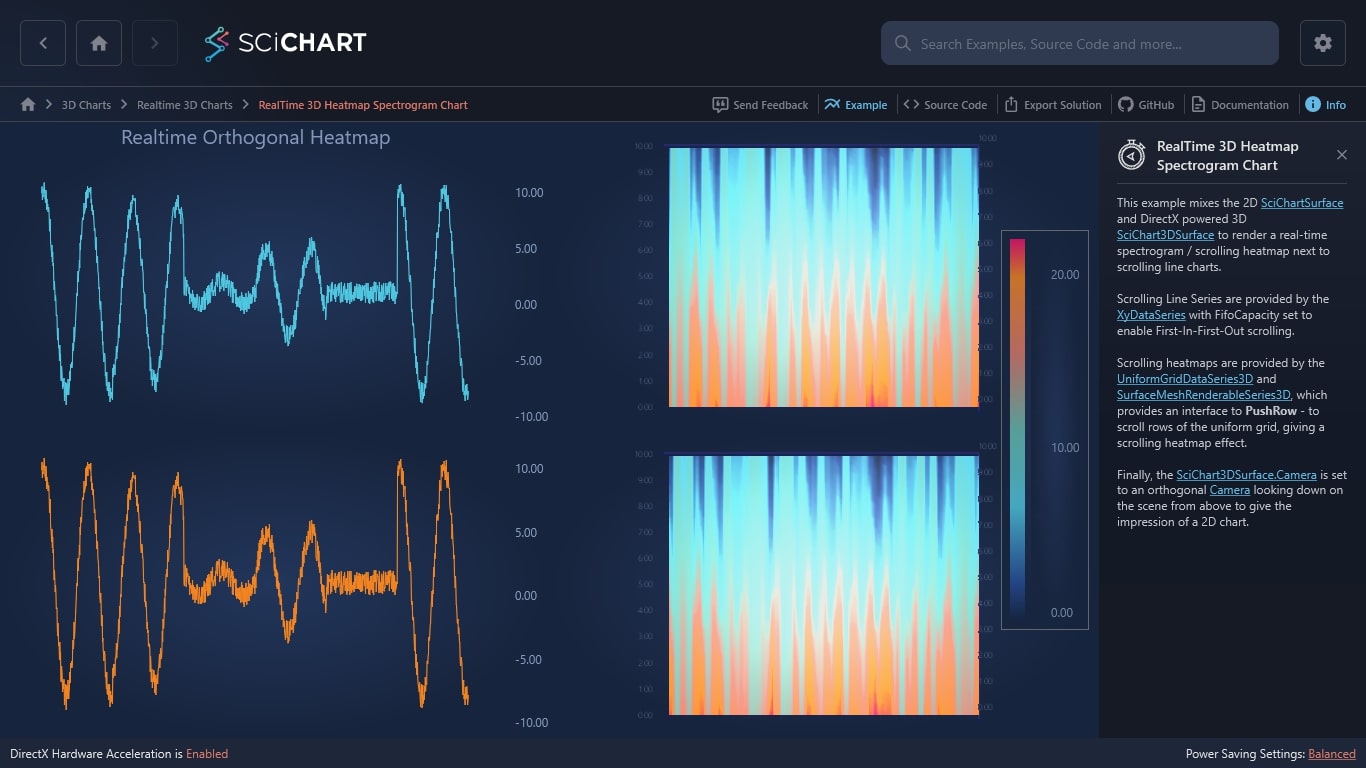
This example mixes the 2D SciChartSurface and DirectX powered 3D SciChart3DSurface to render a real-time spectrogram / scrolling heatmap next to scrolling line charts.
Scrolling Line Series are provided by the XyDataSeries with FifoCapacity set to enable First-In-First-Out scrolling.
Scrolling heatmaps are provided by the UniformGridDataSeries3D and SurfaceMeshRenderableSeries3D, which provides an interface to PushRow – to scroll rows of the uniform grid, giving a scrolling heatmap effect.
Finally, the SciChart3DSurface.Camera is set to an orthogonal Camera looking down on the scene from above to give the impression of a 2D chart.

The C#/WPF source code for the WPF 3D Chart RealTime 3D Heatmap Spectrogram Example example is included below (Scroll down!).
Did you know you can also view the source code from one of the following sources as well?
- Clone the SciChart.WPF.Examples from Github.
- Or, view source in the SciChart WPF Examples suite.
- Also the SciChart WPF Trial contains the full source for the examples (link below).
RealtimeOrthogonalHeatmap3DChart.xaml
View source code<UserControl
x:Class="SciChart.Examples.Examples.Charts3D.CreateRealtime3DCharts.RealtimeOrthogonalHeatmap3DChart"
xmlns="http://schemas.microsoft.com/winfx/2006/xaml/presentation"
xmlns:x="http://schemas.microsoft.com/winfx/2006/xaml"
xmlns:d="http://schemas.microsoft.com/expression/blend/2008"
xmlns:ext="http://schemas.abtsoftware.co.uk/scichart/exampleExternals"
xmlns:mc="http://schemas.openxmlformats.org/markup-compatibility/2006"
xmlns:s="http://schemas.abtsoftware.co.uk/scichart"
xmlns:s3D="http://schemas.abtsoftware.co.uk/scichart3D"
xmlns:system="clr-namespace:System;assembly=mscorlib"
d:DesignHeight="400"
d:DesignWidth="600"
mc:Ignorable="d">
<UserControl.Resources>
<s3D:GradientColorPalette x:Key="ColorPalette" IsStepped="False">
<s3D:GradientColorPalette.GradientStops>
<GradientStop Offset="0" Color="DarkBlue" />
<GradientStop Offset="0.2" Color="MediumBlue" />
<GradientStop Offset="0.4" Color="Blue" />
<GradientStop Offset="0.6" Color="Green" />
<GradientStop Offset="0.8" Color="Yellow" />
<GradientStop Offset="1" Color="Red" />
</s3D:GradientColorPalette.GradientStops>
</s3D:GradientColorPalette>
<LinearGradientBrush x:Key="ColorMapGradient">
<GradientStop Offset="0" Color="DarkBlue" />
<GradientStop Offset="0.2" Color="MediumBlue" />
<GradientStop Offset="0.4" Color="Blue" />
<GradientStop Offset="0.6" Color="Green" />
<GradientStop Offset="0.8" Color="Yellow" />
<GradientStop Offset="1" Color="Red" />
</LinearGradientBrush>
<Style x:Key="Axis2DStyle" TargetType="s:AxisBase">
<Setter Property="DrawMajorBands" Value="False" />
<Setter Property="DrawMajorTicks" Value="False" />
<Setter Property="DrawMajorGridLines" Value="False" />
<Setter Property="DrawMinorTicks" Value="False" />
<Setter Property="DrawMinorGridLines" Value="False" />
</Style>
</UserControl.Resources>
<Grid Background="#FF1C1C1E">
<Grid.ColumnDefinitions>
<ColumnDefinition Width="Auto" />
<ColumnDefinition Width="*" />
<ColumnDefinition Width="*" />
</Grid.ColumnDefinitions>
<Grid.RowDefinitions>
<RowDefinition Height="*" />
<RowDefinition Height="*" />
</Grid.RowDefinitions>
<!-- Create the chart surface -->
<s:SciChartSurface
x:Name="sciChart"
Grid.Column="1"
ChartTitle="Realtime Orthogonal Heatmap">
<!-- Declare RenderableSeries -->
<s:SciChartSurface.RenderableSeries>
<s:FastLineRenderableSeries
x:Name="RenderableSeries0"
Stroke="#FF4083B7"
StrokeThickness="1" />
</s:SciChartSurface.RenderableSeries>
<!-- Create an X Axis -->
<s:SciChartSurface.XAxis>
<s:NumericAxis
AutoRange="Always"
DrawLabels="False"
Style="{StaticResource Axis2DStyle}"
TextFormatting="0.00">
<s:NumericAxis.GrowBy>
<s:DoubleRange Max="0.1" Min="0.1" />
</s:NumericAxis.GrowBy>
</s:NumericAxis>
</s:SciChartSurface.XAxis>
<!-- Create a Y Axis -->
<s:SciChartSurface.YAxis>
<s:NumericAxis
Style="{StaticResource Axis2DStyle}"
TextFormatting="0.00"
VisibleRange="-11, 13">
<s:NumericAxis.GrowBy>
<s:DoubleRange Max="0.1" Min="0.1" />
</s:NumericAxis.GrowBy>
</s:NumericAxis>
</s:SciChartSurface.YAxis>
</s:SciChartSurface>
<!-- Create the chart surface -->
<s3D:SciChart3DSurface
x:Name="SciChart3DSurface"
Grid.Column="2"
BorderThickness="0"
IsFpsCounterVisible="False"
IsXyzGizmoVisible="False"
MaxFrameRate="36"
RenderPriority="Normal"
WorldDimensions="200,100,200">
<!-- Modify Camera Settings -->
<s3D:SciChart3DSurface.Camera>
<s3D:Camera3D
OrbitalPitch="90"
OrbitalYaw="0"
OrthoHeight="235"
OrthoWidth="355"
ProjectionMode="Orthogonal"
ZoomToFitOnAttach="True" />
</s3D:SciChart3DSurface.Camera>
<!-- Declare RenderableSeries -->
<s3D:SciChart3DSurface.RenderableSeries>
<s3D:SurfaceMeshRenderableSeries3D
x:Name="surfaceMesh"
HeightScaleFactor="0"
Maximum="{Binding Maximum, Source={x:Reference surfaceMesh1}, Mode=TwoWay}"
Minimum="{Binding Minimum, Source={x:Reference surfaceMesh1}, Mode=TwoWay}"
MeshColorPalette="{StaticResource ColorPalette}"
StrokeThickness="0" />
</s3D:SciChart3DSurface.RenderableSeries>
<!-- Create an X Axis -->
<s3D:SciChart3DSurface.XAxis>
<s3D:NumericAxis3D
FontSize="8"
VisibleRange="0,10.001"
PlaneBorderThickness="0"/>
</s3D:SciChart3DSurface.XAxis>
<!-- Create a Y Axis -->
<s3D:SciChart3DSurface.YAxis>
<s3D:NumericAxis3D
AutoRange="Always"
DrawLabels="False"
PlaneBorderThickness="0" />
</s3D:SciChart3DSurface.YAxis>
<!-- Create a Z Axis -->
<s3D:SciChart3DSurface.ZAxis>
<s3D:NumericAxis3D
AutoRange="Always"
DrawLabels="False"
FlipCoordinates="True"
PlaneBorderThickness="0"/>
</s3D:SciChart3DSurface.ZAxis>
</s3D:SciChart3DSurface>
<!-- Create the chart surface -->
<s:SciChartSurface
x:Name="sciChart2"
Grid.Row="1"
Grid.Column="1">
<!-- Declare RenderableSeries -->
<s:SciChartSurface.RenderableSeries>
<s:FastLineRenderableSeries
x:Name="RenderableSeries1"
Stroke="Chocolate"
StrokeThickness="1" />
</s:SciChartSurface.RenderableSeries>
<!-- Create an X Axis -->
<s:SciChartSurface.XAxis>
<s:NumericAxis
AutoRange="Always"
DrawLabels="False"
Style="{StaticResource Axis2DStyle}"
TextFormatting="0.00">
<s:NumericAxis.GrowBy>
<s:DoubleRange Max="0.1" Min="0.1" />
</s:NumericAxis.GrowBy>
</s:NumericAxis>
</s:SciChartSurface.XAxis>
<!-- Create a Y Axis -->
<s:SciChartSurface.YAxis>
<s:NumericAxis
Style="{StaticResource Axis2DStyle}"
TextFormatting="0.00"
VisibleRange="-11, 13">
<s:NumericAxis.GrowBy>
<s:DoubleRange Max="0.1" Min="0.1" />
</s:NumericAxis.GrowBy>
</s:NumericAxis>
</s:SciChartSurface.YAxis>
</s:SciChartSurface>
<!-- Create the chart surface -->
<s3D:SciChart3DSurface
x:Name="SciChart3DSurface2"
Grid.Row="1"
Grid.Column="2"
BorderThickness="0"
IsFpsCounterVisible="False"
IsXyzGizmoVisible="False"
MaxFrameRate="36"
RenderPriority="Normal"
WorldDimensions="200,100,200">
<!-- Modify Camera Settings -->
<s3D:SciChart3DSurface.Camera>
<s3D:Camera3D
OrbitalPitch="90"
OrbitalYaw="0"
OrthoHeight="235"
OrthoWidth="355"
ProjectionMode="Orthogonal"
ZoomToFitOnAttach="True" />
</s3D:SciChart3DSurface.Camera>
<!-- Declare RenderableSeries -->
<s3D:SciChart3DSurface.RenderableSeries>
<s3D:SurfaceMeshRenderableSeries3D
x:Name="surfaceMesh1"
HeightScaleFactor="0"
Maximum="0"
Minimum="11"
MeshColorPalette="{StaticResource ColorPalette}"
StrokeThickness="0" />
</s3D:SciChart3DSurface.RenderableSeries>
<!-- Create an X Axis -->
<s3D:SciChart3DSurface.XAxis>
<s3D:NumericAxis3D
FontSize="8"
VisibleRange="0,10.001"
PlaneBorderThickness="0" />
</s3D:SciChart3DSurface.XAxis>
<!-- Create a Y Axis -->
<s3D:SciChart3DSurface.YAxis>
<s3D:NumericAxis3D
AutoRange="Always"
DrawLabels="False"
PlaneBorderThickness="0" />
</s3D:SciChart3DSurface.YAxis>
<!-- Create a Z Axis -->
<s3D:SciChart3DSurface.ZAxis>
<s3D:NumericAxis3D
AutoRange="Always"
DrawLabels="False"
FlipCoordinates="True"
PlaneBorderThickness="0" />
</s3D:SciChart3DSurface.ZAxis>
</s3D:SciChart3DSurface>
<!-- Create HeatmapColorMap -->
<s:HeatmapColorMap
x:Name="HeatmapColorMap"
Grid.Row="0"
Grid.RowSpan="2"
Grid.Column="2"
Height="400"
Margin="10"
HorizontalAlignment="Right"
VerticalAlignment="Center"
Background="{Binding Source={x:Reference SciChart3DSurface}, Path=Background}"
BorderBrush="#777"
BorderThickness="1"
ColorMap="{StaticResource ColorMapGradient}"
Foreground="{Binding Source={x:Reference SciChart3DSurface}, Path=Foreground}"
Maximum="{Binding Maximum, Source={x:Reference surfaceMesh1}, Mode=TwoWay}"
Minimum="{Binding Minimum, Source={x:Reference surfaceMesh1}, Mode=TwoWay}"
Opacity="0.8"
Orientation="Vertical"
TextFormatting="0.00" />
</Grid>
</UserControl>
RealtimeOrthogonalHeatmap3DChart.xaml.cs
View source code// *************************************************************************************
// SCICHART® Copyright SciChart Ltd. 2011-2022. All rights reserved.
//
// Web: http://www.scichart.com
// Support: support@scichart.com
// Sales: sales@scichart.com
//
// RealtimeOrthogonalHeatmap3DChart.xaml.cs is part of the SCICHART® Examples. Permission is hereby granted
// to modify, create derivative works, distribute and publish any part of this source
// code whether for commercial, private or personal use.
//
// The SCICHART® examples are distributed in the hope that they will be useful, but
// without any warranty. It is provided "AS IS" without warranty of any kind, either
// expressed or implied.
// *************************************************************************************
using System;
using System.Linq;
using System.Windows;
using System.Windows.Controls;
using System.Windows.Threading;
using SciChart.Charting.Model.DataSeries;
using SciChart.Charting3D.Model;
namespace SciChart.Examples.Examples.Charts3D.CreateRealtime3DCharts
{
/// <summary>
/// Interaction logic for RealtimeOrthogonalHeatmap3DChart.xaml
/// </summary>
public partial class RealtimeOrthogonalHeatmap3DChart : UserControl
{
// Data Sample Rate (sec)
private double dt = 0.02;
// FIFO Size is 1200 samples, meaning after 1200 samples have been appended, each new sample appended
// results in one sample being discarded
private int FifoSize = 1200;
// Timer to process updates
private readonly DispatcherTimer _timerNewDataUpdate;
// The current time
private double t;
private int _tick;
private int _step = 3;
// A drop in replacement for System.Random which is 3x faster: https://www.codeproject.com/Articles/9187/A-fast-equivalent-for-System-Random
Random _random = new Random();
// The dataseries to fill
private IXyDataSeries<double, double> _series0;
private UniformGridDataSeries3D<double> _series1;
private UniformGridDataSeries3D<double> _series2;
private readonly double[] _tValues = new double[100];
private readonly double[] _yValues = new double[100];
public RealtimeOrthogonalHeatmap3DChart()
{
InitializeComponent();
Loaded += OnLoaded;
Unloaded += OnUnloaded;
_timerNewDataUpdate = new DispatcherTimer(DispatcherPriority.Render);
_timerNewDataUpdate.Tick += OnNewData;
_timerNewDataUpdate.Interval = TimeSpan.FromMilliseconds(25);
CreateDataSetAndSeries();
}
private void OnUnloaded(object sender, RoutedEventArgs routedEventArgs)
{
_timerNewDataUpdate.Stop();
}
private void OnLoaded(object sender, RoutedEventArgs routedEventArgs)
{
_timerNewDataUpdate.Start();
}
private void CreateDataSetAndSeries()
{
_series0 = new XyDataSeries<double, double>();
_series1 = new UniformGridDataSeries3D<double>(100, 100) { StartX = 0, StepX = 0.1, StartZ = 0 };
_series2 = new UniformGridDataSeries3D<double>(100, 100) { StartX = 0, StepX = 0.1, StartZ = 0 };
_series0.FifoCapacity = FifoSize;
for (int a = 0; a < FifoSize; a++)
{
OnNewData(this, null);
}
RenderableSeries0.DataSeries = _series0;
surfaceMesh.Maximum = 22;
surfaceMesh.Minimum = 0;
surfaceMesh.DataSeries = _series1;
RenderableSeries1.DataSeries = _series0;
surfaceMesh1.Maximum = 22;
surfaceMesh1.Minimum = 0;
surfaceMesh1.DataSeries = _series2;
}
// Add 100 new data to DataSeries's
private void OnNewData(object sender, EventArgs e)
{
_tick++;
if (_tick == 2)
{
_tick = 0;
_step = _random.Next(0, 11);
}
var massVal = new double[100];
for (int i = 0; i < 100; i++)
{
double y = _step * Math.Sin(((2 * Math.PI) * 0.4) * t) + _random.NextDouble() * 2;
_yValues[i] = y;
_tValues[i] = t;
massVal[i] = y + 10;
t += dt;
}
var sortData = massVal.OrderByDescending(x => x);
using (_series0.SuspendUpdates())
using (_series1.SuspendUpdates())
using (_series2.SuspendUpdates())
{
_series0.Append(_tValues, _yValues);
_series1.PushRow(sortData.ToArray());
_series2.PushRow(sortData.ToArray());
}
}
}
}