WPF Chart - Examples
SciChart WPF ships with hundreds of WPF Chart Examples which you can browse, play with, view the source-code and even export each WPF Chart Example to a stand-alone Visual Studio solution. All of this is possible with the new and improved SciChart WPF Examples Suite, which ships as part of the SciChart WPF SDK.
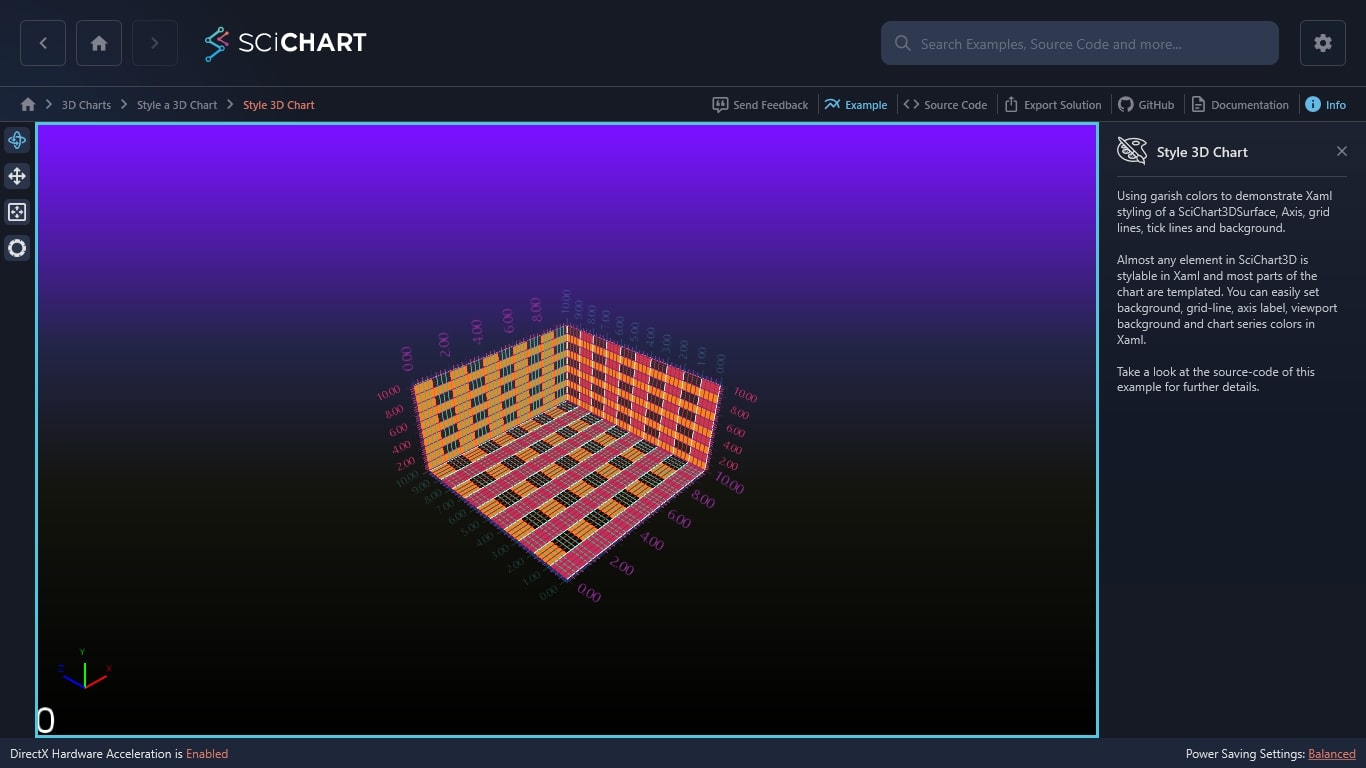
Using garish colors to demonstrate Xaml styling of a SciChart3DSurface, Axis, grid lines, tick lines and background.
Almost any element in SciChart3D is stylable in Xaml and most parts of the chart are templated. You can easily set background, grid-line, axis label, viewport background and chart series colors in Xaml.
Take a look at the source-code of this example for further details.

The C#/WPF source code for the WPF 3D Chart Styling in XAML Example example is included below (Scroll down!).
Did you know you can also view the source code from one of the following sources as well?
- Clone the SciChart.WPF.Examples from Github.
- Or, view source in the SciChart WPF Examples suite.
- Also the SciChart WPF Trial contains the full source for the examples (link below).
Style3DChart.xaml
View source code<UserControl x:Class="SciChart.Examples.Examples.Charts3D.StyleA3DChart.Style3DChart"
xmlns="http://schemas.microsoft.com/winfx/2006/xaml/presentation"
xmlns:x="http://schemas.microsoft.com/winfx/2006/xaml"
xmlns:d="http://schemas.microsoft.com/expression/blend/2008"
xmlns:ext="http://schemas.abtsoftware.co.uk/scichart/exampleExternals"
xmlns:mc="http://schemas.openxmlformats.org/markup-compatibility/2006"
xmlns:s="http://schemas.abtsoftware.co.uk/scichart"
xmlns:s3D="http://schemas.abtsoftware.co.uk/scichart3D"
xmlns:system="clr-namespace:System;assembly=mscorlib"
d:DesignHeight="400"
d:DesignWidth="600"
mc:Ignorable="d">
<UserControl.Resources>
<!-- Define styles for the SciChart3DSurface -->
<Style x:Key="SciChartSurfaceStyle" TargetType="s3D:SciChart3DSurface">
<Setter Property="Background" Value="Orange" />
<Setter Property="Foreground" Value="DarkOrchid" />
<Setter Property="FontSize" Value="20" />
<Setter Property="FontFamily" Value="Arial Black" />
<Setter Property="FontWeight" Value="Bold" />
</Style>
<!-- Define styles for the X and Y Axes -->
<Style x:Key="XAxisStyle" TargetType="s3D:AxisBase3D">
<Setter Property="FontSize" Value="13" />
<Setter Property="FontWeight" Value="Normal" />
<Setter Property="FontFamily" Value="Segoe UI" />
<Setter Property="TickTextBrush" Value="Lime" />
<Setter Property="DrawMajorBands" Value="True" />
<Setter Property="AxisBandsFill" Value="DarkOliveGreen" />
<Setter Property="MajorTickLineStyle">
<Setter.Value>
<Style TargetType="Line">
<Setter Property="Stroke" Value="Lime" />
<Setter Property="StrokeThickness" Value="1" />
<Setter Property="X2" Value="8" />
<Setter Property="Y2" Value="8" />
</Style>
</Setter.Value>
</Setter>
<Setter Property="MinorTickLineStyle">
<Setter.Value>
<Style TargetType="Line">
<Setter Property="Stroke" Value="MediumVioletRed" />
<Setter Property="StrokeThickness" Value="1" />
<Setter Property="X2" Value="4" />
<Setter Property="Y2" Value="4" />
</Style>
</Setter.Value>
</Setter>
<Setter Property="MajorGridLineStyle">
<Setter.Value>
<Style TargetType="Line">
<Setter Property="Stroke" Value="Lime" />
<Setter Property="StrokeThickness" Value="1" />
<Setter Property="StrokeDashArray" Value="10 5" />
</Style>
</Setter.Value>
</Setter>
<Setter Property="MinorGridLineStyle">
<Setter.Value>
<Style TargetType="Line">
<Setter Property="Stroke" Value="DarkViolet" />
<Setter Property="StrokeThickness" Value="1" />
<Setter Property="StrokeDashArray" Value="2 2" />
</Style>
</Setter.Value>
</Setter>
</Style>
<Style x:Key="YAxisStyle" TargetType="s3D:AxisBase3D">
<Setter Property="FontSize" Value="10" />
<Setter Property="FontWeight" Value="Normal" />
<Setter Property="FontFamily" Value="Segoe UI" />
<Setter Property="TickTextBrush" Value="Firebrick" />
<Setter Property="DrawMajorBands" Value="True" />
<Setter Property="AxisBandsFill" Value="Tomato" />
<Setter Property="MajorTickLineStyle">
<Setter.Value>
<Style TargetType="Line">
<Setter Property="Stroke" Value="Firebrick" />
<Setter Property="StrokeThickness" Value="1" />
<Setter Property="X2" Value="8" />
<Setter Property="Y2" Value="8" />
</Style>
</Setter.Value>
</Setter>
<Setter Property="MinorTickLineStyle">
<Setter.Value>
<Style TargetType="Line">
<Setter Property="Stroke" Value="IndianRed" />
<Setter Property="StrokeThickness" Value="1" />
<Setter Property="X2" Value="4" />
<Setter Property="Y2" Value="4" />
</Style>
</Setter.Value>
</Setter>
<Setter Property="MajorGridLineStyle">
<Setter.Value>
<Style TargetType="Line">
<Setter Property="Stroke" Value="DarkGreen" />
<Setter Property="StrokeThickness" Value="1" />
<Setter Property="StrokeDashArray" Value="10 5" />
</Style>
</Setter.Value>
</Setter>
<Setter Property="MinorGridLineStyle">
<Setter.Value>
<Style TargetType="Line">
<Setter Property="Stroke" Value="DeepSkyBlue" />
<Setter Property="StrokeThickness" Value="1" />
<Setter Property="StrokeDashArray" Value="2 2" />
</Style>
</Setter.Value>
</Setter>
</Style>
<Style x:Key="ZAxisStyle" TargetType="s3D:AxisBase3D">
<Setter Property="FontSize" Value="10" />
<Setter Property="FontWeight" Value="Normal" />
<Setter Property="FontFamily" Value="Segoe UI" />
<Setter Property="TickTextBrush" Value="PaleVioletRed" />
<Setter Property="DrawMajorBands" Value="True" />
<Setter Property="AxisBandsFill" Value="GreenYellow" />
<Setter Property="MajorTickLineStyle">
<Setter.Value>
<Style TargetType="Line">
<Setter Property="Stroke" Value="PaleVioletRed" />
<Setter Property="StrokeThickness" Value="1" />
<Setter Property="X2" Value="8" />
<Setter Property="Y2" Value="8" />
</Style>
</Setter.Value>
</Setter>
<Setter Property="MinorTickLineStyle">
<Setter.Value>
<Style TargetType="Line">
<Setter Property="Stroke" Value="Chartreuse" />
<Setter Property="StrokeThickness" Value="1" />
<Setter Property="X2" Value="4" />
<Setter Property="Y2" Value="4" />
</Style>
</Setter.Value>
</Setter>
<Setter Property="MajorGridLineStyle">
<Setter.Value>
<Style TargetType="Line">
<Setter Property="Stroke" Value="Beige" />
<Setter Property="StrokeThickness" Value="1" />
<Setter Property="StrokeDashArray" Value="10 5" />
</Style>
</Setter.Value>
</Setter>
<Setter Property="MinorGridLineStyle">
<Setter.Value>
<Style TargetType="Line">
<Setter Property="Stroke" Value="Brown" />
<Setter Property="StrokeThickness" Value="1" />
<Setter Property="StrokeDashArray" Value="2 2" />
</Style>
</Setter.Value>
</Setter>
</Style>
</UserControl.Resources>
<Grid>
<Grid.ColumnDefinitions>
<ColumnDefinition Width="Auto" />
<ColumnDefinition Width="*" />
</Grid.ColumnDefinitions>
<!-- The SciChart3DInteractionToolbar adds rotate, orbit, zoom, pan, zoom extents functionality -->
<!-- to the chart and is included for example purposes. -->
<!-- If you wish to know how to zoom and pan a 3D chart then do a search for Zoom Pan in the Examples suite! -->
<ext:SciChart3DInteractionToolbar TargetSurface="{Binding Source={x:Reference Name=sciChart}}" />
<s3D:SciChart3DSurface x:Name="sciChart"
Grid.Column="1"
BorderBrush="Yellow"
BorderThickness="3"
Style="{StaticResource SciChartSurfaceStyle}"
WorldDimensions="200,100,200">
<s3D:SciChart3DSurface.Background>
<LinearGradientBrush StartPoint="0.5,0" EndPoint="0.5,1">
<GradientStop Offset="0.022" Color="#FF3D4703" />
<GradientStop Offset="1" Color="Black" />
<GradientStop Offset="0.36" Color="#FF232518" />
<GradientStop Offset="0.6" Color="#FF13140D" />
<GradientStop Offset="0.6" Color="#FF13140D" />
</LinearGradientBrush>
</s3D:SciChart3DSurface.Background>
<s3D:SciChart3DSurface.Camera>
<s3D:Camera3D ZoomToFitOnAttach="True" />
</s3D:SciChart3DSurface.Camera>
<s3D:SciChart3DSurface.XAxis>
<s3D:NumericAxis3D GrowBy="0.1, 0.1" Style="{StaticResource XAxisStyle}" />
</s3D:SciChart3DSurface.XAxis>
<s3D:SciChart3DSurface.YAxis>
<s3D:NumericAxis3D GrowBy="0.1, 0.1" Style="{StaticResource YAxisStyle}" />
</s3D:SciChart3DSurface.YAxis>
<s3D:SciChart3DSurface.ZAxis>
<s3D:NumericAxis3D GrowBy="0.1, 0.1" Style="{StaticResource ZAxisStyle}" />
</s3D:SciChart3DSurface.ZAxis>
</s3D:SciChart3DSurface>
</Grid>
</UserControl>
Style3DChart.xaml.cs
View source code// *************************************************************************************
// SCICHART® Copyright SciChart Ltd. 2011-2022. All rights reserved.
//
// Web: http://www.scichart.com
// Support: support@scichart.com
// Sales: sales@scichart.com
//
// Style3DChart.xaml.cs is part of the SCICHART® Examples. Permission is hereby granted
// to modify, create derivative works, distribute and publish any part of this source
// code whether for commercial, private or personal use.
//
// The SCICHART® examples are distributed in the hope that they will be useful, but
// without any warranty. It is provided "AS IS" without warranty of any kind, either
// expressed or implied.
// *************************************************************************************
using System;
using System.Collections.Generic;
using System.Linq;
using System.Text;
using System.Windows;
using System.Windows.Controls;
using System.Windows.Data;
using System.Windows.Documents;
using System.Windows.Input;
using System.Windows.Media;
using System.Windows.Media.Imaging;
using System.Windows.Navigation;
using System.Windows.Shapes;
using SciChart.Charting;
using SciChart.Charting3D.Model;
using SciChart.Charting3D.PointMarkers;
using SciChart.Examples.ExternalDependencies.Data;
namespace SciChart.Examples.Examples.Charts3D.StyleA3DChart
{
/// <summary>
/// Interaction logic for Style3DChart.xaml
/// </summary>
public partial class Style3DChart : UserControl
{
public Style3DChart()
{
InitializeComponent();
}
}
}
