WPF Chart - Examples
SciChart WPF ships with hundreds of WPF Chart Examples which you can browse, play with, view the source-code and even export each WPF Chart Example to a stand-alone Visual Studio solution. All of this is possible with the new and improved SciChart WPF Examples Suite, which ships as part of the SciChart WPF SDK.
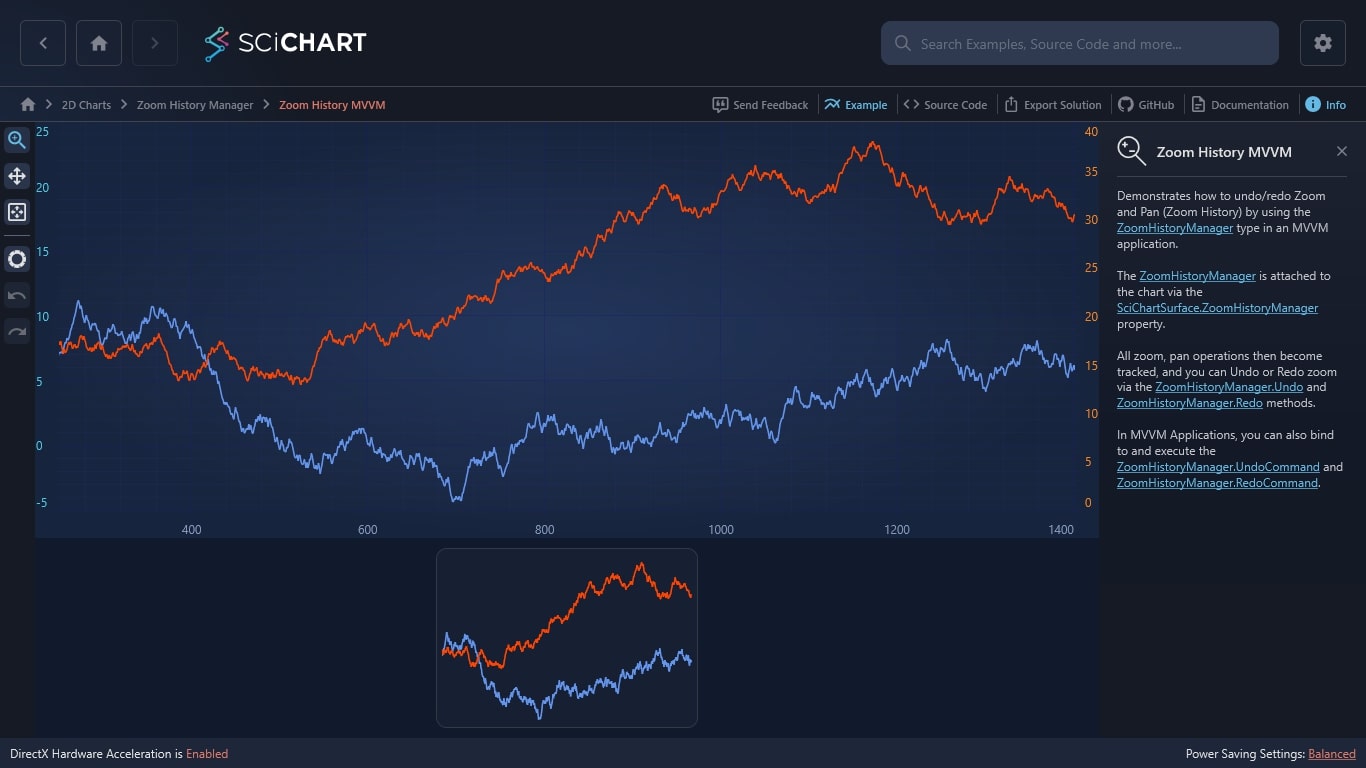
Demonstrates how to undo/redo Zoom and Pan (Zoom History) by using the ZoomHistoryManager type in an MVVM application.
The ZoomHistoryManager is attached to the chart via the SciChartSurface.ZoomHistoryManager property.
All zoom, pan operations then become tracked, and you can Undo or Redo zoom via the ZoomHistoryManager.Undo and ZoomHistoryManager.Redo methods.
In MVVM Applications, you can also bind to and execute the ZoomHistoryManager.UndoCommand and ZoomHistoryManager.RedoCommand.

The C#/WPF source code for the WPF Chart Undo Redo Zoom in MVVM example is included below (Scroll down!).
Did you know you can also view the source code from one of the following sources as well?
- Clone the SciChart.WPF.Examples from Github.
- Or, view source in the SciChart WPF Examples suite.
- Also the SciChart WPF Trial contains the full source for the examples (link below).
ZoomHistoryMvvmView.xaml
View source code<UserControl x:Class="SciChart.Examples.Examples.ZoomHistory.ZoomHistoryMVVM.ZoomHistoryMvvmView"
xmlns="http://schemas.microsoft.com/winfx/2006/xaml/presentation"
xmlns:x="http://schemas.microsoft.com/winfx/2006/xaml"
xmlns:coverFlow="clr-namespace:SciChart.Examples.ExternalDependencies.Controls.CoverFlow;assembly=SciChart.Examples.ExternalDependencies"
xmlns:d="http://schemas.microsoft.com/expression/blend/2008"
xmlns:ex="http://schemas.abtsoftware.co.uk/scichart/exampleExternals"
xmlns:mc="http://schemas.openxmlformats.org/markup-compatibility/2006"
xmlns:s="http://schemas.abtsoftware.co.uk/scichart"
xmlns:system="clr-namespace:System;assembly=mscorlib"
d:DesignHeight="400"
d:DesignWidth="600"
mc:Ignorable="d">
<UserControl.Resources>
<ResourceDictionary>
<Style x:Key="ConciseAxisStyle" TargetType="s:AxisBase">
<Setter Property="Visibility" Value="Collapsed" />
<Setter Property="DrawMajorGridLines" Value="False" />
<Setter Property="DrawMinorGridLines" Value="False" />
<Setter Property="DrawMajorBands" Value="False" />
<Setter Property="AutoRange" Value="Never" />
</Style>
<system:String x:Key="XAxisId">XAxisId</system:String>
<system:String x:Key="YAxis0Id">Y0AxisId</system:String>
<system:String x:Key="YAxis1Id">Y1AxisId</system:String>
<Style x:Key="FirstLineRenderableSeriesStyle" TargetType="s:FastLineRenderableSeriesForMvvm">
<Setter Property="XAxisId" Value="{StaticResource XAxisId}"/>
<Setter Property="YAxisId" Value="{StaticResource YAxis0Id}"/>
</Style>
<Style x:Key="SecondLineRenderableSeriesStyle" TargetType="s:FastLineRenderableSeriesForMvvm">
<Setter Property="XAxisId" Value="{StaticResource XAxisId}"/>
<Setter Property="YAxisId" Value="{StaticResource YAxis1Id}"/>
</Style>
</ResourceDictionary>
</UserControl.Resources>
<Grid Background="#FF1C1C1E">
<Grid.ColumnDefinitions>
<ColumnDefinition Width="Auto" />
<ColumnDefinition Width="*" />
</Grid.ColumnDefinitions>
<Grid.RowDefinitions>
<RowDefinition Height="*" />
<RowDefinition Height="Auto" />
</Grid.RowDefinitions>
<!-- The SciChartInteractionToolbar adds zoom, pan, zoom extents and rotate functionality -->
<!-- to the chart and is included for example purposes. -->
<!-- If you wish to know how to zoom and pan a chart then do a search for Zoom Pan in the Examples suite! -->
<ex:SciChartInteractionToolbar Grid.RowSpan="2" TargetSurface="{Binding ElementName=sciChart}">
<Button Command="{Binding UndoCommand}"
Content="UN"
FontSize="11"
Padding="0"
Style="{StaticResource DefaultButtonStyle}"
ToolTipService.ToolTip="UNDO Zoom" />
<Button Command="{Binding RedoCommand}"
Content="RE"
FontSize="11"
Padding="0"
Style="{StaticResource DefaultButtonStyle}"
ToolTipService.ToolTip="REDO Zoom" />
</ex:SciChartInteractionToolbar>
<!-- Shows the SciChartSurface and binds ZoomHistoryManager to the instance in the viewmodel -->
<!-- This is what we use to control zoom history as well as Undo Redo -->
<s:SciChartSurface x:Name="sciChart"
Grid.Row="0"
Grid.Column="1"
RenderableSeries="{s:SeriesBinding RenderableSeriesViewModels}"
ZoomHistoryManager="{Binding ZoomHistoryManager, Mode=TwoWay}">
<!-- Create an X Axis with GrowBy -->
<s:SciChartSurface.XAxis>
<s:NumericAxis x:Name="XAxis"
Id="{StaticResource XAxisId}"
VisibleRange="250,1400" />
</s:SciChartSurface.XAxis>
<s:SciChartSurface.YAxes>
<s:NumericAxis x:Name="YAxis0"
AxisAlignment="Left"
BorderBrush="#FF6495ed"
Id="{StaticResource YAxis0Id}"
TickTextBrush="#FF6495ed"
VisibleRange="-5,25" />
<s:NumericAxis x:Name="YAxis1"
AxisAlignment="Right"
BorderBrush="#FFFF4500"
Id="{StaticResource YAxis1Id}"
TickTextBrush="#FFFF4500"
VisibleRange="0,40" />
</s:SciChartSurface.YAxes>
<s:SciChartSurface.ChartModifier>
<s:ModifierGroup>
<s:XAxisDragModifier />
<s:YAxisDragModifier />
<s:MouseWheelZoomModifier/>
</s:ModifierGroup>
</s:SciChartSurface.ChartModifier>
</s:SciChartSurface>
<!-- Eye candy ;-) -->
<!-- Draws a carousel of items at the footer of the example showing previous zoom states. -->
<!-- To simply enable Undo Redo just call ZoomHistoryManager.Undo and .Redo -->
<Grid Grid.Row="1" Grid.Column="1">
<Grid.ColumnDefinitions>
<ColumnDefinition Width="Auto" />
<ColumnDefinition Width="*" />
<ColumnDefinition Width="620" />
<ColumnDefinition Width="*" />
<ColumnDefinition Width="Auto" />
</Grid.ColumnDefinitions>
<Button Grid.Column="0"
Command="{Binding UndoCommand}"
Style="{StaticResource BackButtonPathStyle}" />
<coverFlow:CoverFlowControl Grid.Column="1"
Grid.ColumnSpan="3"
Height="180"
Margin="10"
HorizontalAlignment="Stretch"
VerticalAlignment="Center"
ItemsSource="{Binding RangesHistory, Mode=OneWay}"
Scale="0.65"
SelectionColor="#FF2C3135"
SelectedItem="{Binding SelectedRange, Mode=TwoWay}"
NextPrevSelectionOnly="True"
SpaceBetweenItems="180"
SpaceBetweenSelectedItemAndItems="50"
HideOverlappedSideItems="True">
<coverFlow:CoverFlowControl.ItemTemplate>
<DataTemplate>
<Border Background="#FF1C1C1E"
BorderBrush="#FF2C3135"
BorderThickness="3">
<s:SciChartSurface Width="250"
Height="170"
Margin="-1"
FontSize="12"
RenderableSeries="{s:SeriesBinding DataContext.RenderableSeriesViewModels, RelativeSource={RelativeSource AncestorType=ListBox}}">
<s:SciChartSurface.Resources>
<Style BasedOn="{StaticResource ConciseAxisStyle}" TargetType="s:NumericAxis" />
</s:SciChartSurface.Resources>
<s:SciChartSurface.XAxis>
<s:NumericAxis Id="{StaticResource XAxisId}" VisibleRange="{Binding XAxisRange}" />
</s:SciChartSurface.XAxis>
<s:SciChartSurface.YAxes>
<s:NumericAxis Id="{StaticResource YAxis0Id}" VisibleRange="{Binding Y0AxisRange}" />
<s:NumericAxis Id="{StaticResource YAxis1Id}" VisibleRange="{Binding Y1AxisRange}" />
</s:SciChartSurface.YAxes>
</s:SciChartSurface>
</Border>
</DataTemplate>
</coverFlow:CoverFlowControl.ItemTemplate>
</coverFlow:CoverFlowControl>
<Border Grid.Column="1" Background="#FF1C1C1E">
<Border.OpacityMask>
<LinearGradientBrush StartPoint="0,0" EndPoint="1,0">
<GradientStop Offset="0" Color="#FF1C1C1E"/>
<GradientStop Offset="1" Color="Transparent"/>
</LinearGradientBrush>
</Border.OpacityMask>
</Border>
<Border Grid.Column="3" Background="#FF1C1C1E">
<Border.OpacityMask>
<LinearGradientBrush StartPoint="1,0" EndPoint="0,0">
<GradientStop Offset="0" Color="#FF1C1C1E"/>
<GradientStop Offset="1" Color="Transparent"/>
</LinearGradientBrush>
</Border.OpacityMask>
</Border>
<Button Grid.Column="4"
Command="{Binding RedoCommand}"
Style="{StaticResource NextButtonPathStyle}" />
</Grid>
</Grid>
</UserControl>ZoomHistoryMvvmView.xaml.cs
View source code// *************************************************************************************
// SCICHART® Copyright SciChart Ltd. 2011-2022. All rights reserved.
//
// Web: http://www.scichart.com
// Support: support@scichart.com
// Sales: sales@scichart.com
//
// ZoomHistoryMvvmView.xaml.cs is part of the SCICHART® Examples. Permission is hereby granted
// to modify, create derivative works, distribute and publish any part of this source
// code whether for commercial, private or personal use.
//
// The SCICHART® examples are distributed in the hope that they will be useful, but
// without any warranty. It is provided "AS IS" without warranty of any kind, either
// expressed or implied.
// *************************************************************************************
using System.Windows.Controls;
namespace SciChart.Examples.Examples.ZoomHistory.ZoomHistoryMVVM
{
/// <summary>
/// Interaction logic for ZoomHistoryMvvmView.xaml
/// </summary>
public partial class ZoomHistoryMvvmView : UserControl
{
public ZoomHistoryMvvmView()
{
InitializeComponent();
}
}
}ZoomHistoryMvvmViewModel.cs
View source code// *************************************************************************************
// SCICHART® Copyright SciChart Ltd. 2011-2022. All rights reserved.
//
// Web: http://www.scichart.com
// Support: support@scichart.com
// Sales: sales@scichart.com
//
// ZoomHistoryMvvmViewModel.cs is part of the SCICHART® Examples. Permission is hereby granted
// to modify, create derivative works, distribute and publish any part of this source
// code whether for commercial, private or personal use.
//
// The SCICHART® examples are distributed in the hope that they will be useful, but
// without any warranty. It is provided "AS IS" without warranty of any kind, either
// expressed or implied.
// *************************************************************************************
using System;
using System.Collections.Generic;
using System.Collections.ObjectModel;
using System.Windows.Input;
using System.Windows.Media;
using SciChart.Charting.Common.Extensions;
using SciChart.Charting.Common.Helpers;
using SciChart.Charting.HistoryManagers;
using SciChart.Charting.Model.ChartSeries;
using SciChart.Charting.Model.DataSeries;
using SciChart.Data.Model;
using SciChart.Examples.ExternalDependencies.Common;
namespace SciChart.Examples.Examples.ZoomHistory.ZoomHistoryMVVM
{
public class ZoomHistoryMvvmViewModel : BaseViewModel
{
private static readonly AxisKey _xAxisKey = new AxisKey("XAxisId", true);
private static readonly AxisKey _y0AxisKey = new AxisKey("Y0AxisId", false);
private static readonly AxisKey _y1AxisKey = new AxisKey("Y1AxisId", false);
private readonly RangeHistorySameCompare _rangeHistoryCompare;
private const int AxisAmount = 3;
public class ChartRangeHistory : BaseViewModel
{
public ChartRangeHistory(IDictionary<AxisKey, IRange> ranges, string itemId)
{
ItemId = itemId;
foreach (var pair in ranges)
{
if (pair.Key.Id == _xAxisKey.Id && pair.Key.IsXAxis == _xAxisKey.IsXAxis)
{
XAxisRange = pair.Value;
}
else if (pair.Key.Id == _y0AxisKey.Id && pair.Key.IsXAxis == _y0AxisKey.IsXAxis)
{
Y0AxisRange = pair.Value;
}
else if (pair.Key.Id == _y1AxisKey.Id && pair.Key.IsXAxis == _y1AxisKey.IsXAxis)
{
Y1AxisRange = pair.Value;
}
}
}
public string ItemId { get; }
public IRange XAxisRange { get; set; }
public IRange Y0AxisRange { get; set; }
public IRange Y1AxisRange { get; set; }
public override int GetHashCode()
{
return ItemId.GetHashCode();
}
public override bool Equals(object obj)
{
return obj is ChartRangeHistory other && Equals(other);
}
public bool Equals(ChartRangeHistory other)
{
if (other == null) return false;
if (ReferenceEquals(this, other)) return true;
return other.XAxisRange.Equals(XAxisRange) &&
other.Y0AxisRange.Equals(Y0AxisRange) &&
other.Y1AxisRange.Equals(Y1AxisRange);
}
}
public class RangeHistorySameCompare : EqualityComparer<ChartRangeHistory>
{
public override bool Equals(ChartRangeHistory crh1, ChartRangeHistory crh2)
{
if (crh1 == null && crh2 == null) return true;
if (crh1 == null || crh2 == null) return false;
return crh1.ItemId == crh2.ItemId;
}
public override int GetHashCode(ChartRangeHistory crh)
{
return crh.ItemId.GetHashCode();
}
}
private readonly Random _random = new Random(251916);
private const int Count = 2000;
private IZoomHistoryManager _zoomHistoryManager;
private readonly ActionCommand _undoCommand;
private readonly ActionCommand _redoCommand;
private ObservableCollection<ChartRangeHistory> _rangesHistory = new ObservableCollection<ChartRangeHistory>();
private ChartRangeHistory _selectedRange;
private ObservableCollection<IRenderableSeriesViewModel> _renderableSeriesViewModels;
public ZoomHistoryMvvmViewModel()
{
_rangeHistoryCompare = new RangeHistorySameCompare();
var vm1 = new LineRenderableSeriesViewModel
{
DataSeries = FillData(new UniformXyDataSeries<double>(), "firstDataSeries"),
StyleKey = "FirstLineRenderableSeriesStyle",
StrokeThickness = 2,
Stroke = Color.FromArgb(0xff, 0x64, 0x95, 0xed),
};
var vm2 = new LineRenderableSeriesViewModel
{
DataSeries = FillData(new UniformXyDataSeries<double>(), "secondDataSeries"),
StyleKey = "SecondLineRenderableSeriesStyle",
StrokeThickness = 2,
Stroke = Color.FromArgb(0xff, 0xff, 0x45, 0x00),
};
RenderableSeriesViewModels = new ObservableCollection<IRenderableSeriesViewModel> { vm1, vm2 };
_zoomHistoryManager = new ZoomHistoryManager();
_zoomHistoryManager.RangeHistoryChanged += OnRangeHistoryChanged;
_undoCommand = new ActionCommand(() =>
{
_zoomHistoryManager.Undo();
var index = RangesHistory.IndexOf(_selectedRange, _rangeHistoryCompare);
_selectedRange = RangesHistory[index - 1];
OnPropertyChanged("SelectedRange");
RaiseUndoRedoCanExecute();
}, () => _zoomHistoryManager.CanUndo() &&
RangesHistory.IndexOf(_selectedRange, _rangeHistoryCompare) > 0);
_redoCommand = new ActionCommand(() =>
{
if (_zoomHistoryManager.CanRedo())
{
_zoomHistoryManager.Redo();
var index = RangesHistory.IndexOf(_selectedRange, _rangeHistoryCompare);
_selectedRange = RangesHistory[index + 1];
OnPropertyChanged("SelectedRange");
RaiseUndoRedoCanExecute();
}
}, () => _zoomHistoryManager.CanRedo() &&
RangesHistory.IndexOf(_selectedRange, _rangeHistoryCompare) < RangesHistory.Count - 1);
}
public IZoomHistoryManager ZoomHistoryManager
{
get => _zoomHistoryManager;
set
{
_zoomHistoryManager = value;
OnPropertyChanged("ZoomHistoryManager");
}
}
public ObservableCollection<ChartRangeHistory> RangesHistory
{
get => _rangesHistory;
set
{
_rangesHistory = value;
OnPropertyChanged("RangesHistory");
}
}
public ChartRangeHistory SelectedRange
{
get => _selectedRange;
set
{
var currentIndex = _rangesHistory.IndexOf(_selectedRange, _rangeHistoryCompare);
var newIndex = _rangesHistory.IndexOf(value, _rangeHistoryCompare);
var times = currentIndex - newIndex;
if (times > 0)
{
for (int i = 0; i < times; i++)
{
_zoomHistoryManager.Undo();
}
}
else if (times < 0)
{
for (int i = 0; i < Math.Abs(times); i++)
{
_zoomHistoryManager.Redo();
}
}
_selectedRange = value;
OnPropertyChanged("SelectedRange");
RaiseUndoRedoCanExecute();
}
}
public ObservableCollection<IRenderableSeriesViewModel> RenderableSeriesViewModels
{
get => _renderableSeriesViewModels;
set
{
_renderableSeriesViewModels = value;
OnPropertyChanged("RenderableSeriesViewModels");
}
}
public ICommand UndoCommand => _undoCommand;
public ICommand RedoCommand => _redoCommand;
private void OnRangeHistoryChanged(object sender, HistoryChangedEventArgs args)
{
if (args.OldRanges != null)
{
for (int i = 0; i < args.DisposedAmount; i++)
{
RangesHistory.RemoveAt(RangesHistory.Count - 1);
}
}
if (args.NewRanges != null && args.NewRanges.Count > 0)
{
var newRanges = args.NewRanges;
if (newRanges.Count < AxisAmount)
{
newRanges = FillRanges(newRanges);
}
var item = new ChartRangeHistory(newRanges, Guid.NewGuid().ToString());
RangesHistory.Add(item);
while (RangesHistory.Count > ZoomHistoryManager.HistoryDepth)
{
RangesHistory.RemoveAt(0);
}
OnPropertyChanged("RangesHistory");
_selectedRange = item;
OnPropertyChanged("SelectedRange");
}
RaiseUndoRedoCanExecute();
}
private IDictionary<AxisKey, IRange> FillRanges(IDictionary<AxisKey, IRange> ranges)
{
var dict = new Dictionary<AxisKey, IRange>(ranges);
if (!ranges.ContainsKey(_xAxisKey))
{
dict.Add(_xAxisKey, RangesHistory[RangesHistory.Count - 1].XAxisRange);
}
if (!ranges.ContainsKey(_y0AxisKey))
{
dict.Add(_y0AxisKey, RangesHistory[RangesHistory.Count - 1].Y0AxisRange);
}
if (!ranges.ContainsKey(_y1AxisKey))
{
dict.Add(_y1AxisKey, RangesHistory[RangesHistory.Count - 1].Y1AxisRange);
}
return dict;
}
private void RaiseUndoRedoCanExecute()
{
_undoCommand.RaiseCanExecuteChanged();
_redoCommand.RaiseCanExecuteChanged();
}
private IDataSeries FillData(IUniformXyDataSeries<double> dataSeries, string name)
{
double randomWalk = 10.0;
double[] yBuffer = new double[Count];
for (int i = 0; i < Count; i++)
{
randomWalk += _random.NextDouble() - 0.498;
yBuffer[i] = randomWalk;
}
// Buffer above and append all in one go to avoid multiple recalculations of series range
dataSeries.Append(yBuffer);
dataSeries.SeriesName = name;
return dataSeries;
}
}
}