WPF Chart - Examples
SciChart WPF ships with hundreds of WPF Chart Examples which you can browse, play with, view the source-code and even export each WPF Chart Example to a stand-alone Visual Studio solution. All of this is possible with the new and improved SciChart WPF Examples Suite, which ships as part of the SciChart WPF SDK.
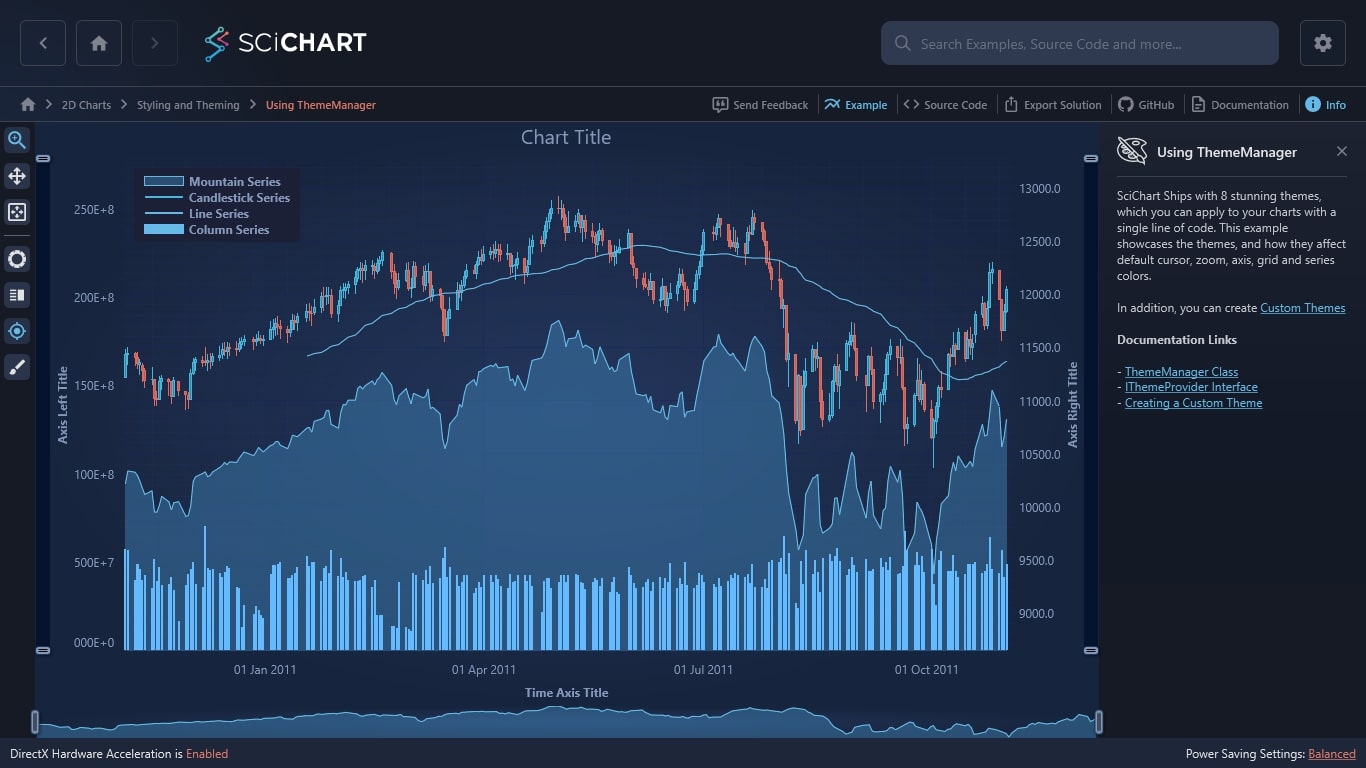
SciChart Ships with 8 stunning themes, which you can apply to your charts with a single line of code. This example showcases the themes, and how they affect default cursor, zoom, axis, grid and series colors.
In addition, you can create Custom Themes
Documentation Links
– ThemeManager Class
– IThemeProvider Interface
– Creating a Custom Theme

The C#/WPF source code for the WPF Chart ThemeManager example is included below (Scroll down!).
Did you know you can also view the source code from one of the following sources as well?
- Clone the SciChart.WPF.Examples from Github.
- Or, view source in the SciChart WPF Examples suite.
- Also the SciChart WPF Trial contains the full source for the examples (link below).
ChangeTheme.xaml
View source code<UserControl x:Class="SciChart.Examples.Examples.StyleAChart.UsingThemeManager.ChangeTheme"
xmlns="http://schemas.microsoft.com/winfx/2006/xaml/presentation"
xmlns:x="http://schemas.microsoft.com/winfx/2006/xaml"
xmlns:d="http://schemas.microsoft.com/expression/blend/2008"
xmlns:ext="http://schemas.abtsoftware.co.uk/scichart/exampleExternals"
xmlns:mc="http://schemas.openxmlformats.org/markup-compatibility/2006"
xmlns:s="http://schemas.abtsoftware.co.uk/scichart"
Loaded="ChangeTheme_Loaded"
d:DesignHeight="400"
d:DesignWidth="600"
mc:Ignorable="d">
<Grid>
<Grid.RowDefinitions>
<RowDefinition Height="*" />
<RowDefinition Height="32" />
</Grid.RowDefinitions>
<Grid.ColumnDefinitions>
<ColumnDefinition Width="Auto" />
<ColumnDefinition />
</Grid.ColumnDefinitions>
<ext:SciChartInteractionToolbar x:Name="UserToolbar"
Grid.RowSpan="2"
TargetSurface="{Binding Source={x:Reference Name=sciChart}}">
<ext:FlyoutMenuButton HorizontalAlignment="Left"
Content="THM"
Padding="0"
FontSize="10"
HorizontalContentAlignment="Center"
Style="{StaticResource FlyoutMenuButtonStyle}"
ToolTipService.ToolTip="Theme changing"
Visibility="{Binding Source={x:Static ext:DeveloperModManager.Manage},
Path=IsDeveloperMode,
Converter={StaticResource BoolSwitchVisibilityConverter}}">
<ext:FlyoutMenuButton.PopupContent>
<StackPanel MinWidth="150" Orientation="Vertical">
<TextBlock Text="Update Theme" />
<ext:FlyoutSeparator />
<ComboBox x:Name="cboTheme"
ItemsSource="{Binding Source={x:Static s:ThemeManager.AllThemes}}"
SelectionChanged="CboThemeChanged" />
</StackPanel>
</ext:FlyoutMenuButton.PopupContent>
</ext:FlyoutMenuButton>
</ext:SciChartInteractionToolbar>
<s:SciChartSurface x:Name="sciChart"
Grid.Column="1"
ChartTitle="Chart Title">
<!-- Add some sample RenderableSeries. Each theme has a default style for these -->
<s:SciChartSurface.RenderableSeries>
<s:FastMountainRenderableSeries x:Name="mountainSeries" YAxisId="PrimaryAxisId" />
<s:FastCandlestickRenderableSeries x:Name="candlestickSeries"
AntiAliasing="False"
YAxisId="PrimaryAxisId" />
<s:FastLineRenderableSeries x:Name="lineSeries" YAxisId="PrimaryAxisId" />
<s:FastColumnRenderableSeries x:Name="columnSeries" YAxisId="SecondaryAxisId" />
</s:SciChartSurface.RenderableSeries>
<!-- Add a DateTime XAxis -->
<s:SciChartSurface.XAxis>
<s:DateTimeAxis x:Name="xAxis" AxisTitle="Time Axis Title" />
</s:SciChartSurface.XAxis>
<!-- Add two YAxes, to display price and volume data -->
<s:SciChartSurface.YAxes>
<s:NumericAxis AxisAlignment="Right"
AxisTitle="Axis Right Title"
DrawMajorBands="True"
Id="PrimaryAxisId"
TextFormatting="#.0">
<s:NumericAxis.GrowBy>
<!--
Using GrowBy of 10% below and 20% above, has the effect of
aligning all series on this axis just below centre
-->
<s:DoubleRange Max="0.1" Min="0.20" />
</s:NumericAxis.GrowBy>
<s:NumericAxis.Scrollbar>
<s:SciChartScrollbar />
</s:NumericAxis.Scrollbar>
</s:NumericAxis>
<s:NumericAxis AxisAlignment="Left"
AxisTitle="Axis Left Title"
Id="SecondaryAxisId"
TextFormatting="###E+0">
<s:NumericAxis.GrowBy>
<!--
Using GrowBy of 0% below and 300% above, has the effect of
aligning all series on this axis to the bottom quarter of the axis
-->
<s:DoubleRange Max="3.0" Min="0" />
</s:NumericAxis.GrowBy>
<s:NumericAxis.Scrollbar>
<s:SciChartScrollbar />
</s:NumericAxis.Scrollbar>
</s:NumericAxis>
</s:SciChartSurface.YAxes>
<!-- Add some modifiers to zoom, zoom extents -->
<s:SciChartSurface.ChartModifier>
<s:ModifierGroup>
<s:XAxisDragModifier />
<s:YAxisDragModifier AxisId="SecondaryAxisId" />
<s:YAxisDragModifier AxisId="PrimaryAxisId" />
<s:LegendModifier Margin="10"
ShowLegend="True"
ShowVisibilityCheckboxes="False" />
<s:ZoomExtentsModifier ExecuteOn="MouseDoubleClick" />
<s:CursorModifier ReceiveHandledEvents="True"
ShowAxisLabels="True"
ShowTooltip="True"
ShowTooltipOn="MouseRightButtonDown" />
</s:ModifierGroup>
</s:SciChartSurface.ChartModifier>
</s:SciChartSurface>
<s:SciChartOverview x:Name="overview"
Grid.Row="1"
Grid.Column="1"
SelectedRange="{Binding Source={x:Reference Name=sciChart},
Path=XAxis.VisibleRange,
Mode=TwoWay}" />
</Grid>
</UserControl>
ChangeTheme.xaml.cs
View source code// *************************************************************************************
// SCICHART® Copyright SciChart Ltd. 2011-2022. All rights reserved.
//
// Web: http://www.scichart.com
// Support: support@scichart.com
// Sales: sales@scichart.com
//
// ChangeTheme.xaml.cs is part of the SCICHART® Examples. Permission is hereby granted
// to modify, create derivative works, distribute and publish any part of this source
// code whether for commercial, private or personal use.
//
// The SCICHART® examples are distributed in the hope that they will be useful, but
// without any warranty. It is provided "AS IS" without warranty of any kind, either
// expressed or implied.
// *************************************************************************************
using System;
using System.Linq;
using System.Windows;
using System.Windows.Controls;
using SciChart.Charting;
using SciChart.Charting.Model.DataSeries;
using SciChart.Examples.ExternalDependencies.Common;
using SciChart.Examples.ExternalDependencies.Data;
namespace SciChart.Examples.Examples.StyleAChart.UsingThemeManager
{
public partial class ChangeTheme : UserControl
{
public ChangeTheme()
{
InitializeComponent();
// Fill theme combo box and set default theme
cboTheme.SelectedItem = ThemeManager.DefaultTheme;
}
private void ChangeTheme_Loaded(object sender, RoutedEventArgs e)
{
using (sciChart.SuspendUpdates())
{
// Create some dataseries of type x=DateTime, y=Double
var dataSeries0 = new XyDataSeries<DateTime, double> {SeriesName = "Mountain Series"};
var dataSeries1 = new OhlcDataSeries<DateTime, double> {SeriesName = "Candlestick Series"};
var dataSeries2 = new XyDataSeries<DateTime, double> {SeriesName = "Line Series"};
var dataSeries3 = new XyDataSeries<DateTime, double> {SeriesName = "Column Series"};
var dataSource = DataManager.Instance;
// Prices are in the format Time, Open, High, Low, Close (all IList)
var prices = dataSource.GetPriceData(Instrument.Indu.Value, TimeFrame.Daily);
// Append data to series.
dataSeries0.Append(prices.TimeData, dataSource.Offset(prices.LowData, -1000));
dataSeries1.Append(prices.TimeData, prices.OpenData, prices.HighData, prices.LowData, prices.CloseData);
dataSeries2.Append(prices.TimeData, dataSource.ComputeMovingAverage(prices.CloseData, 50));
dataSeries3.Append(prices.TimeData, prices.VolumeData.Select(x => (double) x));
// Assign data to RenderableSeries
mountainSeries.DataSeries = dataSeries0;
candlestickSeries.DataSeries = dataSeries1;
lineSeries.DataSeries = dataSeries2;
columnSeries.DataSeries = dataSeries3;
overview.ParentSurface = sciChart;
sciChart.ZoomExtents();
}
}
private void CboThemeChanged(object sender, SelectionChangedEventArgs e)
{
ThemeManager.SetTheme(sciChart, (string)cboTheme.SelectedItem);
ThemeManager.SetTheme(overview, (string)cboTheme.SelectedItem);
}
}
}