WPF Chart - Examples
SciChart WPF ships with hundreds of WPF Chart Examples which you can browse, play with, view the source-code and even export each WPF Chart Example to a stand-alone Visual Studio solution. All of this is possible with the new and improved SciChart WPF Examples Suite, which ships as part of the SciChart WPF SDK.
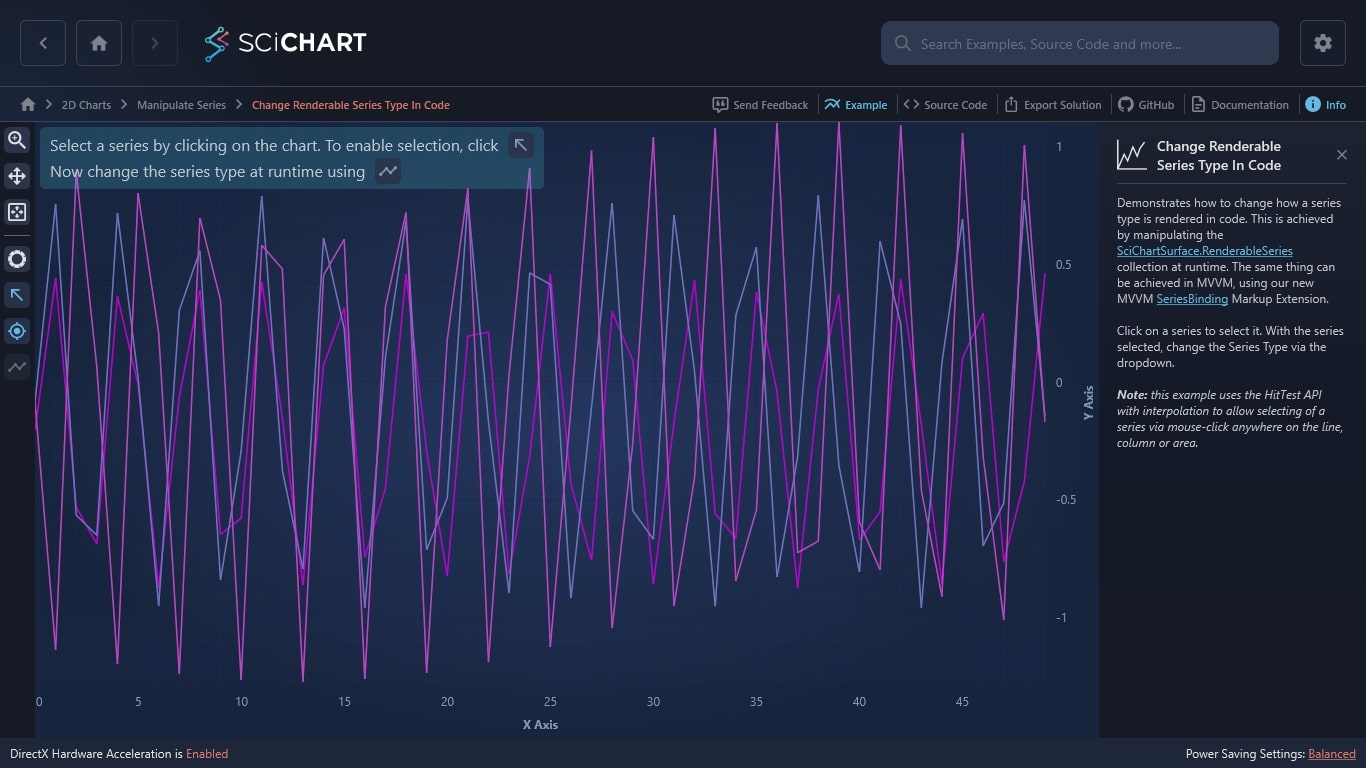
Demonstrates how to change how a series type is rendered in code. This is achieved by manipulating the SciChartSurface.RenderableSeries collection at runtime. The same thing can be achieved in MVVM, using our new MVVM SeriesBinding Markup Extension.
Click on a series to select it. With the series selected, change the Series Type via the dropdown.
Note: this example uses the HitTest API with interpolation to allow selecting of a series via mouse-click anywhere on the line, column or area.

The C#/WPF source code for the WPF Chart Change Series Type example is included below (Scroll down!).
Did you know you can also view the source code from one of the following sources as well?
- Clone the SciChart.WPF.Examples from Github.
- Or, view source in the SciChart WPF Examples suite.
- Also the SciChart WPF Trial contains the full source for the examples (link below).
ChangeRenderableSeriesTypeExampleView.xaml
View source code<UserControl x:Class="SciChart.Examples.Examples.ManipulateSeries.ChangeRenderableSeriesType"
xmlns="http://schemas.microsoft.com/winfx/2006/xaml/presentation"
xmlns:x="http://schemas.microsoft.com/winfx/2006/xaml"
xmlns:s="http://schemas.abtsoftware.co.uk/scichart"
xmlns:mc="http://schemas.openxmlformats.org/markup-compatibility/2006"
xmlns:ext="http://schemas.abtsoftware.co.uk/scichart/exampleExternals"
xmlns:d="http://schemas.microsoft.com/expression/blend/2008"
d:DesignHeight="400"
d:DesignWidth="600"
mc:Ignorable="d">
<UserControl.Resources>
<ext:TypeToTypeNameConverter x:Key="TypeToTypeNameConverter" />
<ext:BoolToValueConverter x:Key="InvertBooleanConverter" TrueValue="False" FalseValue="True"/>
<s:ColorToBrushConverter x:Key="ColorToBrushConverter"/>
<!-- These styles are just used to make the selection more apparent and make the example easier to use -->
<Style TargetType="s:FastColumnRenderableSeries">
<Setter Property="StrokeThickness" Value="2"/>
<Setter Property="Fill" Value="{Binding Stroke, RelativeSource={RelativeSource Self}, Converter={StaticResource ColorToBrushConverter}, ConverterParameter=0.3}"/>
<Setter Property="DataPointWidth" Value="0.8"/>
</Style>
<Style TargetType="s:FastMountainRenderableSeries">
<Setter Property="StrokeThickness" Value="2"/>
<Setter Property="Fill" Value="{Binding Stroke, RelativeSource={RelativeSource Self}, Converter={StaticResource ColorToBrushConverter}, ConverterParameter=0.3}"/>
</Style>
<Style TargetType="s:FastImpulseRenderableSeries">
<Setter Property="StrokeThickness" Value="3"/>
<Setter Property="PointMarkerTemplate">
<Setter.Value>
<ControlTemplate>
<s:EllipsePointMarker Width="9" Height="9" Fill="{Binding DataContext.Stroke, RelativeSource={RelativeSource TemplatedParent}}" />
</ControlTemplate>
</Setter.Value>
</Setter>
</Style>
<Style TargetType="s:FastLineRenderableSeries">
<Setter Property="StrokeThickness" Value="2"/>
</Style>
</UserControl.Resources>
<Grid>
<Grid.ColumnDefinitions>
<ColumnDefinition Width="Auto" />
<ColumnDefinition Width="*" />
</Grid.ColumnDefinitions>
<ext:SciChartInteractionToolbar TargetSurface="{Binding Source={x:Reference Name=sciChart}}">
<ext:FlyoutMenuButton Style="{StaticResource FlyoutMenuButtonStyle}" Content="TYPE" Padding="0">
<ext:FlyoutMenuButton.PopupContent>
<StackPanel Orientation="Vertical" MinWidth="150">
<TextBlock Text="Selected Series Type" />
<ext:FlyoutSeparator/>
<ComboBox x:Name="seriesTypesCombo" SelectionChanged="SeriesComboSelectionChanged" Margin="4">
<ComboBox.ItemTemplate>
<DataTemplate>
<TextBlock Text="{Binding Converter={StaticResource TypeToTypeNameConverter}}" />
</DataTemplate>
</ComboBox.ItemTemplate>
</ComboBox>
</StackPanel>
</ext:FlyoutMenuButton.PopupContent>
</ext:FlyoutMenuButton>
</ext:SciChartInteractionToolbar>
<s:SciChartSurface x:Name="sciChart" Grid.Column="1">
<s:SciChartSurface.XAxis>
<s:NumericAxis AxisTitle="X Axis" />
</s:SciChartSurface.XAxis>
<s:SciChartSurface.YAxis>
<s:NumericAxis AxisTitle="Y Axis" />
</s:SciChartSurface.YAxis>
<s:SciChartSurface.ChartModifier>
<s:ModifierGroup>
<s:RubberBandXyZoomModifier IsEnabled="{Binding ElementName=enableZoom, Path=IsChecked}" IsXAxisOnly="True"/>
<s:ZoomPanModifier IsEnabled="{Binding ElementName=enablePan, Path=IsChecked}" ClipModeX="None"/>
<s:SeriesSelectionModifier SelectionChanged="SeriesSelectionModifierSelectionChanged" ReceiveHandledEvents="True">
<s:SeriesSelectionModifier.SelectedSeriesStyle>
<Style TargetType="s:BaseRenderableSeries">
<Setter Property="Stroke" Value="White"/>
<Setter Property="PointMarkerTemplate">
<Setter.Value>
<ControlTemplate>
<s:EllipsePointMarker x:Name="PART_PointMarker"
Width="5"
Height="5"
Fill="#77777777"
Stroke="White"
StrokeThickness="2" />
</ControlTemplate>
</Setter.Value>
</Setter>
</Style>
</s:SeriesSelectionModifier.SelectedSeriesStyle>
</s:SeriesSelectionModifier>
<s:ZoomExtentsModifier/>
<s:CursorModifier ShowAxisLabels="False" ShowTooltip="False" ReceiveHandledEvents="True" />
</s:ModifierGroup>
</s:SciChartSurface.ChartModifier>
<!-- Some hints to the user -->
<s:SciChartSurface.Annotations>
<s:CustomAnnotation CoordinateMode="Relative"
HorizontalAnchorPoint="Left"
Margin="5,18,0,0"
VerticalAnchorPoint="Center"
IsHidden="{Binding ElementName=sciChart, Path=SelectedRenderableSeries.Count}"
X1="0"
Y1="0" >
<StackPanel Orientation="Horizontal">
<TextBlock FontSize="20"
Opacity="0.7"
Background="#232323"
Margin="0 0 5 0"
Text="Select a Series by clicking on the chart ..."
Foreground="#FFF" />
<Image Width="32"
Height="32"
Source="/SciChart.Examples;component/Resources/Images/pointbutton_icon.png"
Stretch="None" />
</StackPanel>
</s:CustomAnnotation>
<s:CustomAnnotation CoordinateMode="Relative"
HorizontalAnchorPoint="Left"
VerticalAnchorPoint="Center"
IsHidden="{Binding ElementName=sciChart, Path=SelectedRenderableSeries.Count, Converter={StaticResource InvertBooleanConverter}}"
Margin="5,18,0,0"
X1="0"
Y1="0" >
<StackPanel Orientation="Horizontal">
<TextBlock FontSize="20"
Opacity="0.7"
Background="#232323"
Margin="0 0 5 0"
Text="Now change the type at runtime!"
Foreground="#FFF" />
<Image Width="32"
Height="32"
Source="/SciChart.Examples;component/Resources/Images/type_button.png"
Stretch="None" />
</StackPanel>
</s:CustomAnnotation>
</s:SciChartSurface.Annotations>
</s:SciChartSurface>
</Grid>
</UserControl>
ChangeRenderableSeriesTypeExampleView.xaml.cs
View source code// *************************************************************************************
// SCICHART® Copyright SciChart Ltd. 2011-2022. All rights reserved.
//
// Web: http://www.scichart.com
// Support: support@scichart.com
// Sales: sales@scichart.com
//
// ChangeRenderableSeriesTypeExampleView.xaml.cs is part of the SCICHART® Examples. Permission is hereby granted
// to modify, create derivative works, distribute and publish any part of this source
// code whether for commercial, private or personal use.
//
// The SCICHART® examples are distributed in the hope that they will be useful, but
// without any warranty. It is provided "AS IS" without warranty of any kind, either
// expressed or implied.
// *************************************************************************************
using System;
using System.Linq;
using System.Windows.Controls;
using SciChart.Charting.Model.DataSeries;
using SciChart.Charting.Visuals.RenderableSeries;
using SciChart.Examples.ExternalDependencies.Data;
namespace SciChart.Examples.Examples.ManipulateSeries
{
/// <summary>
/// Interaction logic for ChangeRenderableSeriesType.xaml
/// </summary>
public partial class ChangeRenderableSeriesType : UserControl
{
public ChangeRenderableSeriesType()
{
InitializeComponent();
Loaded += ChangeRenderableSeriesTypeLoaded;
seriesTypesCombo.Items.Add(typeof (FastLineRenderableSeries));
seriesTypesCombo.Items.Add(typeof (FastColumnRenderableSeries));
seriesTypesCombo.Items.Add(typeof (FastMountainRenderableSeries));
seriesTypesCombo.Items.Add(typeof (FastImpulseRenderableSeries));
}
private void SeriesComboSelectionChanged(object sender, SelectionChangedEventArgs e)
{
// When the selected series type combo changes, update the selected series type
if (seriesTypesCombo.SelectedValue == null ||
!sciChart.SelectedRenderableSeries.Any()) return;
// Get the selected series
var oldSelectedSeries = sciChart.SelectedRenderableSeries.First();
oldSelectedSeries.IsSelected = false;
// Replace it with a new series of the requested type
int index = sciChart.RenderableSeries.IndexOf(oldSelectedSeries);
var oldRenderableSeries = sciChart.RenderableSeries[index];
var newSelectedSeries = (BaseRenderableSeries)Activator.CreateInstance((Type) seriesTypesCombo.SelectedValue);
newSelectedSeries.Stroke = oldSelectedSeries.Stroke;
sciChart.RenderableSeries[index] = newSelectedSeries;
newSelectedSeries.DataSeries = oldRenderableSeries.DataSeries;
}
private void SeriesSelectionModifierSelectionChanged(object sender, EventArgs e)
{
seriesTypesCombo.SelectionChanged -= SeriesComboSelectionChanged;
OnSeriesSelectionChanged();
seriesTypesCombo.SelectionChanged += SeriesComboSelectionChanged;
}
private void OnSeriesSelectionChanged()
{
// When the user selects a new series, set the series type on the combo box
var selectedSeries = sciChart.SelectedRenderableSeries;
bool hasSelection = selectedSeries != null && selectedSeries.Count > 0;
seriesTypesCombo.IsEnabled = hasSelection;
if (hasSelection)
{
seriesTypesCombo.SelectedValue = selectedSeries[0].GetType();
}
}
private void ChangeRenderableSeriesTypeLoaded(object sender, System.Windows.RoutedEventArgs e)
{
// OnLoad, create three data and renderable series
FillData(new XyDataSeries<double, double>());
FillData(new XyDataSeries<double, double>());
FillData(new XyDataSeries<double, double>());
OnSeriesSelectionChanged();
sciChart.ZoomExtents();
}
private void FillData(IXyDataSeries<double, double> dataSeries)
{
var data = DataManager.Instance.GetRandomDoubleSeries(50);
dataSeries.Append(data.XData, data.YData);
sciChart.RenderableSeries.Add(new FastLineRenderableSeries()
{
Stroke = DataManager.Instance.GetRandomColor(),
DataSeries = dataSeries,
});
}
}
}
