WPF Chart - Examples
SciChart WPF ships with hundreds of WPF Chart Examples which you can browse, play with, view the source-code and even export each WPF Chart Example to a stand-alone Visual Studio solution. All of this is possible with the new and improved SciChart WPF Examples Suite, which ships as part of the SciChart WPF SDK.
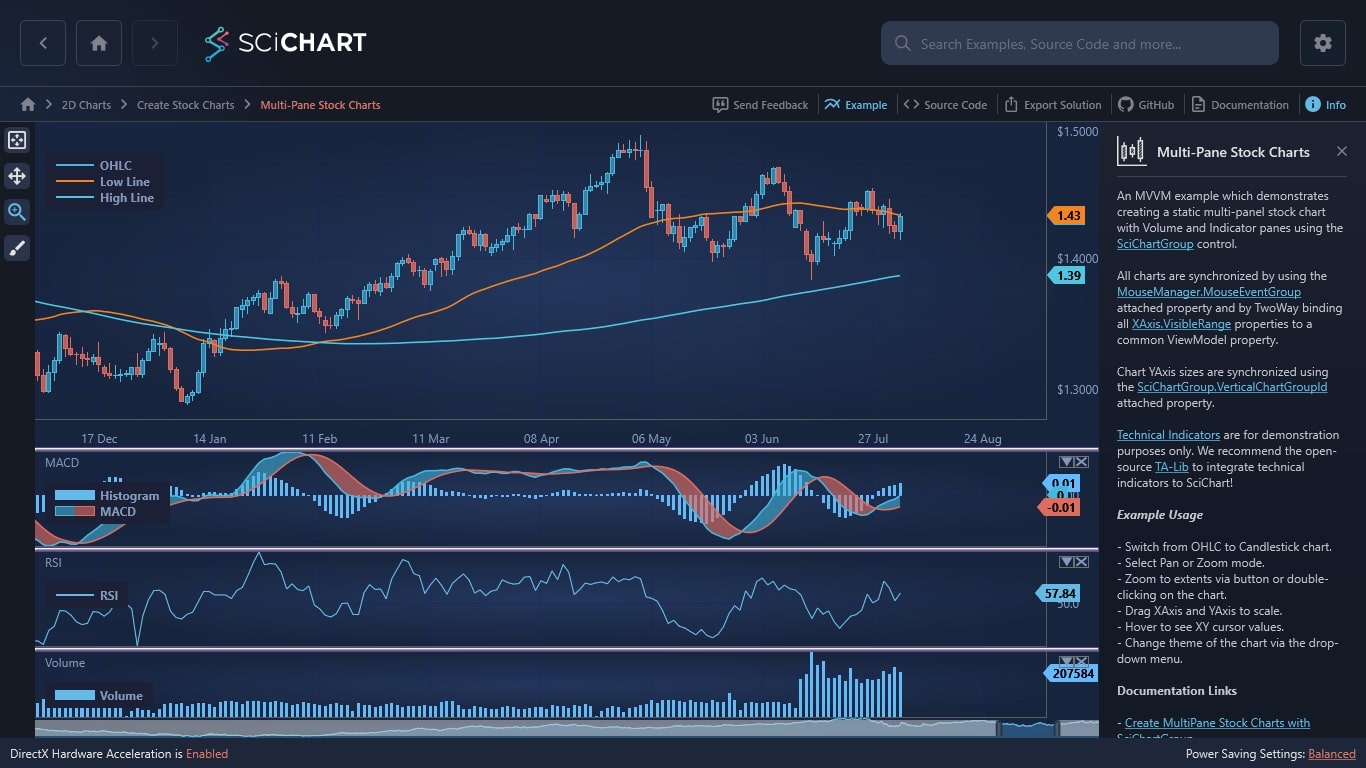
An MVVM example which demonstrates creating a static multi-panel stock chart with Volume and Indicator panes using the SciChartGroup control.
All charts are synchronized by using the MouseManager.MouseEventGroup attached property and by TwoWay binding all XAxis.VisibleRange properties to a common ViewModel property.
Chart YAxis sizes are synchronized using the SciChartGroup.VerticalChartGroupId attached property.
Technical Indicators are for demonstration purposes only. We recommend the open-source TA-Lib to integrate technical indicators to SciChart!
Example Usage
– Switch from OHLC to Candlestick chart.
– Select Pan or Zoom mode.
– Zoom to extents via button or double-clicking on the chart.
– Drag XAxis and YAxis to scale.
– Hover to see XY cursor values.
– Change theme of the chart via the drop-down menu.
Documentation Links
– Create MultiPane Stock Charts with SciChartGroup
– How to add a SciChartOverview or Scrollbar with an ItemsControl of charts, or SciChartGroup
– Does SciChart Support Technical Indicators like MACD, SMA, EMA, RSI?
– SciChartGroup Type
– MouseManager.MouseEventGroup Property
– SciChartGroup.VerticalChartGroupId Property

The C#/WPF source code for the WPF Multi-Pane Stock Charts example is included below (Scroll down!).
Did you know you can also view the source code from one of the following sources as well?
- Clone the SciChart.WPF.Examples from Github.
- Or, view source in the SciChart WPF Examples suite.
- Also the SciChart WPF Trial contains the full source for the examples (link below).
CreateMultiPaneStockCharts.xaml
View source code<UserControl x:Class="SciChart.Examples.Examples.CreateStockCharts.MultiPane.CreateMultiPaneStockCharts"
xmlns="http://schemas.microsoft.com/winfx/2006/xaml/presentation"
xmlns:x="http://schemas.microsoft.com/winfx/2006/xaml"
xmlns:d="http://schemas.microsoft.com/expression/blend/2008"
xmlns:ext="http://schemas.abtsoftware.co.uk/scichart/exampleExternals"
xmlns:mc="http://schemas.openxmlformats.org/markup-compatibility/2006"
xmlns:multiPane="clr-namespace:SciChart.Examples.Examples.CreateStockCharts.MultiPane"
xmlns:s="http://schemas.abtsoftware.co.uk/scichart"
d:DesignHeight="400"
d:DesignWidth="600"
mc:Ignorable="d">
<UserControl.Resources>
<ResourceDictionary>
<ResourceDictionary.MergedDictionaries>
<ResourceDictionary Source="/SciChart.Examples.ExternalDependencies;component/Resources/Styles/MergedResources.xaml" />
<ResourceDictionary Source="/SciChart.Examples.ExternalDependencies;component/Resources/Styles/ToolbarButtonsCommon.xaml" />
</ResourceDictionary.MergedDictionaries>
<!-- This allows setting the Height of a pane from a viewmodel -->
<Style x:Key="ChartPaneStyle" TargetType="s:SciChartGroupPane">
<Setter Property="Height" Value="{Binding PaneViewModel.Height, Mode=TwoWay}" />
</Style>
<!-- This Scrollbar Style applied to the SciChartScrollbar inside the SciChartGroup ItemTemplate -->
<Style x:Key="ScrollBarStyle" TargetType="s:SciChartScrollbar">
<Setter Property="GripsThickness" Value="7" />
<Setter Property="GripsLength" Value="18" />
<Setter Property="Background" Value="Transparent" />
<Setter Property="NonSelectedAreaStyle">
<Setter.Value>
<Style TargetType="Path">
<Setter Property="Fill" Value="#7FD3D3D3" />
</Style>
</Setter.Value>
</Setter>
<Setter Property="ViewportStyle">
<Setter.Value>
<Style TargetType="Control">
<Setter Property="Opacity" Value="0" />
</Style>
</Setter.Value>
</Setter>
<Setter Property="GripsStyle">
<Setter.Value>
<Style TargetType="Control">
<Setter Property="Background" Value="#535353" />
<Setter Property="BorderThickness" Value="2" />
</Style>
</Setter.Value>
</Setter>
</Style>
<Style x:Key="LegendStyle" TargetType="s:LegendModifier">
<Setter Property="LegendPlacement" Value="Inside" />
<Setter Property="Orientation" Value="Vertical" />
<Setter Property="Margin" Value="10,30, 10, 10" />
<Setter Property="ShowVisibilityCheckboxes" Value="False" />
</Style>
<!-- The style applied to the chart behind the scrollbar -->
<Style x:Key="OverviewChartStyle" TargetType="s:SciStockChart">
<Setter Property="BorderThickness" Value="0" />
<Setter Property="Padding" Value="0" />
<Setter Property="Height" Value="20" />
<Setter Property="IsAxisMarkersEnabled" Value="False" />
<Setter Property="IsCursorEnabled" Value="False" />
<Setter Property="IsXAxisVisible" Value="False" />
<Setter Property="IsRubberBandZoomEnabled" Value="False" />
<Setter Property="XAxisStyle">
<Setter.Value>
<Style TargetType="s:CategoryDateTimeAxis">
<Setter Property="AutoRange" Value="Always" />
<Setter Property="Visibility" Value="Collapsed" />
<Setter Property="DrawMajorGridLines" Value="False" />
<Setter Property="DrawMinorGridLines" Value="False" />
</Style>
</Setter.Value>
</Setter>
<Setter Property="YAxisStyle">
<Setter.Value>
<Style TargetType="s:NumericAxis">
<Setter Property="AutoRange" Value="Always" />
<Setter Property="Visibility" Value="Collapsed" />
<Setter Property="DrawMajorGridLines" Value="False" />
<Setter Property="DrawMinorGridLines" Value="False" />
</Style>
</Setter.Value>
</Setter>
</Style>
<!-- A number of converters which change parameters of charts based on the IsFirstChartPane property -->
<ext:BoolToValueConverter x:Key="BoolToVisibilityConverter"
FalseValue="Collapsed"
TrueValue="Visible" />
<ext:BoolToValueConverter x:Key="MinorsPerMajorConverter"
FalseValue="2"
TrueValue="4" />
<ext:BoolToValueConverter x:Key="MaxAutoTicksConverter"
FalseValue="4"
TrueValue="8" />
<ext:BoolToValueConverter x:Key="GrowByConverter">
<ext:BoolToValueConverter.TrueValue>
<s:DoubleRange Max="0.05" Min="0.05" />
</ext:BoolToValueConverter.TrueValue>
<ext:BoolToValueConverter.FalseValue>
<s:DoubleRange Max="0.0" Min="0.0" />
</ext:BoolToValueConverter.FalseValue>
</ext:BoolToValueConverter>
</ResourceDictionary>
</UserControl.Resources>
<Grid>
<Grid.ColumnDefinitions>
<ColumnDefinition Width="Auto" />
<ColumnDefinition Width="*" />
</Grid.ColumnDefinitions>
<!-- ** IGNORE BELOW HERE ** -->
<!-- Define the Toolbar -->
<Border Panel.ZIndex="9999"
Background="#FF232426"
BorderBrush="#323539"
BorderThickness="0,0,2,0">
<WrapPanel HorizontalAlignment="Left" Orientation="Vertical">
<Button HorizontalAlignment="Left"
Command="{Binding ZoomExtentsCommand}"
Content="Zoom Extents"
Style="{StaticResource ZoomExtentsButtonStyle}"
ToolTipService.ToolTip="Zoom to Extents" />
<ToggleButton HorizontalAlignment="Left"
Command="{Binding PanModeCommand}"
Content="Pan"
Style="{StaticResource PanButtonStyle}"
s:ToggleButtonExtensions.GroupName="Modifiers" />
<ToggleButton HorizontalAlignment="Left"
Command="{Binding ZoomModeCommand}"
Content="Zoom"
IsChecked="True"
Style="{StaticResource ZoomButtonStyle}"
s:ToggleButtonExtensions.GroupName="Modifiers" />
<ext:FlyoutMenuButton HorizontalAlignment="Left"
Content="Theme"
Padding="0"
Style="{StaticResource FlyoutMenuButtonStyle}"
ToolTipService.ToolTip="Theme changing">
<ext:FlyoutMenuButton.PopupContent>
<StackPanel MinWidth="150" Orientation="Vertical">
<TextBlock Text="Update Theme" />
<ext:FlyoutSeparator />
<ComboBox x:Name="ThemeCombo"
ItemsSource="{Binding AllThemes}"
SelectedItem="SciChartv4Dark" />
</StackPanel>
</ext:FlyoutMenuButton.PopupContent>
</ext:FlyoutMenuButton>
</WrapPanel>
</Border>
<!-- Databinds a SciChartGroup to a list of ChartPaneViewModels -->
<!-- Child chart panes are generated using the ItemTemplate below -->
<s:SciChartGroup Grid.Column="1"
ItemContainerStyle="{StaticResource ChartPaneStyle}"
ItemsSource="{Binding ChartPaneViewModels}"
s:ThemeManager.Theme="{Binding Source={x:Reference Name=ThemeCombo}, Path=SelectedItem}">
<s:SciChartGroup.ItemTemplate>
<DataTemplate>
<!-- DataTemplate instantiates this View per ChartPaneViewModel -->
<!-- This includes a SciStockChart, which is a specialized form of SciChartSurface -->
<!-- which is tailored for Stock Charts (financial charts) with CategoryDateTimeAxis -->
<!-- -->
<!-- It also includes a SciChartScrollbar to create a custom overview control, which is Collapsed for all but the last pane -->
<Grid>
<Grid.RowDefinitions>
<RowDefinition Height="*" />
<RowDefinition Height="Auto" />
</Grid.RowDefinitions>
<!-- Databinds each child SciStockChart to ... -->
<!-- SeriesSource to BaseChartPaneViewModel.ChartSeriesViewModels -->
<!-- Axis Properties, like s:StockChartXAxis.VisibleRange to CreateMultiPaneStockChartsViewModel.XVisibleRange -->
<!-- Axis Properties, like s:StockChartYAxis.GrowBy to BaseChartPaneViewModel.IsFirstChartPane with a converter to change behaviour based on pane position -->
<s:SciStockChart x:Name="PART_ChartPaneView"
BorderThickness="0,0,1,1"
IsAxisMarkersEnabled="True"
IsCursorEnabled="True"
IsPanEnabled="{Binding ParentViewModel.IsPanEnabled}"
IsRolloverEnabled="False"
IsRubberBandZoomEnabled="{Binding ParentViewModel.IsZoomEnabled}"
IsXAxisVisible="{Binding IsFirstChartPane}"
LegendStyle="{StaticResource LegendStyle}"
Padding="0"
RenderableSeries="{s:SeriesBinding ChartSeriesViewModels}"
VerticalChartGroupId="{Binding ParentViewModel.VerticalChartGroupId}"
ViewportManager="{Binding ViewportManager}"
multiPane:StockChartHelper.ShowTooltipLabel="True">
<s:SciStockChart.Resources>
<Style x:Key="LowLineStyle" TargetType="s:FastLineRenderableSeries">
<Setter Property="Stroke" Value="#ffff3333" />
<Setter Property="StrokeThickness" Value="2" />
</Style>
<Style x:Key="HighLineStyle" TargetType="s:FastLineRenderableSeries">
<Setter Property="Stroke" Value="#ff33dd33" />
<Setter Property="StrokeThickness" Value="2" />
</Style>
</s:SciStockChart.Resources>
<!-- Override any properties of the built-in CategoryDateTimeAxis -->
<s:SciStockChart.XAxisStyle>
<Style TargetType="s:CategoryDateTimeAxis">
<Setter Property="DrawMajorBands" Value="True" />
<Setter Property="DrawMinorGridLines" Value="False" />
<Setter Property="VisibleRange" Value="{Binding ParentViewModel.XVisibleRange, Mode=TwoWay}" />
<Setter Property="GrowBy" Value="0, 0.05" />
</Style>
</s:SciStockChart.XAxisStyle>
<!-- Override any properties of the built-in NumericAxis -->
<s:SciStockChart.YAxisStyle>
<Style TargetType="s:NumericAxis">
<Setter Property="TextFormatting" Value="{Binding YAxisTextFormatting}" />
<Setter Property="AutoRange" Value="Always" />
<Setter Property="MinorsPerMajor" Value="{Binding IsFirstChartPane, Converter={StaticResource MinorsPerMajorConverter}}" />
<Setter Property="MaxAutoTicks" Value="{Binding IsFirstChartPane, Converter={StaticResource MaxAutoTicksConverter}}" />
<Setter Property="GrowBy" Value="{Binding IsFirstChartPane, Converter={StaticResource GrowByConverter}}" />
</Style>
</s:SciStockChart.YAxisStyle>
</s:SciStockChart>
<!-- Displays a SciChartScrollBar bound to the charts XAxis, and visible only for last chart pane -->
<Grid Grid.Row="1" Visibility="{Binding IsLastChartPane, Converter={StaticResource BoolToVisibilityConverter}}">
<!-- This is the Chart behind the scrollbar, bound to the First ChartPaneViewModel, first DataSeries -->
<!-- It displays the data as a FastMountainRenderableSeries -->
<s:SciStockChart x:Name="PART_ScrollbarChartBackground" ShowLegend="False" Style="{StaticResource OverviewChartStyle}">
<s:SciStockChart.RenderableSeries>
<s:FastMountainRenderableSeries DataSeries="{Binding ParentViewModel.ChartPaneViewModels[0].ChartSeriesViewModels[0].DataSeries}" />
</s:SciStockChart.RenderableSeries>
</s:SciStockChart>
<!-- This is the scrollbar, its bound to the PART_ChartPaneView.XAxis above -->
<s:SciChartScrollbar Margin="{Binding Source={x:Reference Name=PART_ChartPaneView}, Path=Padding, Mode=OneWay}"
Axis="{Binding Source={x:Reference Name=PART_ChartPaneView}, Path=XAxis}"
Style="{StaticResource ScrollBarStyle}" />
</Grid>
</Grid>
</DataTemplate>
</s:SciChartGroup.ItemTemplate>
</s:SciChartGroup>
</Grid>
</UserControl>
CreateMultiPaneStockCharts.xaml.cs
View source code// *************************************************************************************
// SCICHART® Copyright SciChart Ltd. 2011-2022. All rights reserved.
//
// Web: http://www.scichart.com
// Support: support@scichart.com
// Sales: sales@scichart.com
//
// CreateMultiPaneStockCharts.xaml.cs is part of the SCICHART® Examples. Permission is hereby granted
// to modify, create derivative works, distribute and publish any part of this source
// code whether for commercial, private or personal use.
//
// The SCICHART® examples are distributed in the hope that they will be useful, but
// without any warranty. It is provided "AS IS" without warranty of any kind, either
// expressed or implied.
// *************************************************************************************
using System.Windows.Controls;
namespace SciChart.Examples.Examples.CreateStockCharts.MultiPane
{
public partial class CreateMultiPaneStockCharts : UserControl
{
public CreateMultiPaneStockCharts()
{
InitializeComponent();
}
}
}CreateMultiPaneStockChartsViewModel.cs
View source code// *************************************************************************************
// SCICHART® Copyright SciChart Ltd. 2011-2022. All rights reserved.
//
// Web: http://www.scichart.com
// Support: support@scichart.com
// Sales: sales@scichart.com
//
// CreateMultiPaneStockChartsViewModel.cs is part of the SCICHART® Examples. Permission is hereby granted
// to modify, create derivative works, distribute and publish any part of this source
// code whether for commercial, private or personal use.
//
// The SCICHART® examples are distributed in the hope that they will be useful, but
// without any warranty. It is provided "AS IS" without warranty of any kind, either
// expressed or implied.
// *************************************************************************************
using System;
using System.Collections.Generic;
using System.Collections.ObjectModel;
using System.Windows.Input;
using SciChart.Charting;
using SciChart.Charting.Common.Helpers;
using SciChart.Charting.ViewportManagers;
using SciChart.Charting.Visuals.TradeChart;
using SciChart.Data.Model;
using SciChart.Examples.ExternalDependencies.Common;
using SciChart.Examples.ExternalDependencies.Data;
namespace SciChart.Examples.Examples.CreateStockCharts.MultiPane
{
public class CreateMultiPaneStockChartsViewModel : BaseViewModel
{
private IndexRange _xAxisVisibleRange;
private ObservableCollection<BaseChartPaneViewModel> _chartPaneViewModels = new ObservableCollection<BaseChartPaneViewModel>();
private readonly ICommand _closePaneCommand;
private bool _isPanEnabled;
private bool _isZoomEnabled;
private string _verticalChartGroupId;
private IViewportManager _viewportManager;
public CreateMultiPaneStockChartsViewModel()
{
ZoomModeCommand = new ActionCommand(SetZoomMode);
PanModeCommand = new ActionCommand(SetPanMode);
ZoomExtentsCommand = new ActionCommand(ZoomExtends);
// Get prices and append for the main price chart (Candlestick)
var instrumentPriceData = DataManager.Instance.GetPriceData(Instrument.EurUsd.Value, TimeFrame.Daily);
// ChartGroup is an ID which is used to synchronize chart pane heights and mouse events. it must be unique per SciChartGroup, but differ if you have many top level SciChartGroups
_verticalChartGroupId = Guid.NewGuid().ToString();
_viewportManager = new DefaultViewportManager();
var closePaneCommand = new ActionCommand<IChildPane>(pane => ChartPaneViewModels.Remove((BaseChartPaneViewModel)pane));
_chartPaneViewModels.Add(new PricePaneViewModel(this, instrumentPriceData) { IsFirstChartPane = true, ViewportManager = _viewportManager });
_chartPaneViewModels.Add(new MacdPaneViewModel(this, instrumentPriceData) { Title = "MACD", ClosePaneCommand = closePaneCommand });
_chartPaneViewModels.Add(new RsiPaneViewModel(this, instrumentPriceData) { Title = "RSI", ClosePaneCommand = closePaneCommand });
_chartPaneViewModels.Add(new VolumePaneViewModel(this, instrumentPriceData) { Title = "Volume", ClosePaneCommand = closePaneCommand, IsLastChartPane = true});
SetZoomMode();
}
private void ZoomExtends()
{
_viewportManager.AnimateZoomExtents(TimeSpan.FromMilliseconds(500));
}
public IEnumerable<string> AllThemes { get { return ThemeManager.AllThemes; } }
public ICommand ZoomModeCommand { get; private set; }
public ICommand PanModeCommand { get; private set; }
public ICommand ZoomExtentsCommand { get; private set; }
public string VerticalChartGroupId
{
get { return _verticalChartGroupId; }
set
{
if (_verticalChartGroupId == value) return;
_verticalChartGroupId = value;
OnPropertyChanged("VerticalChartGroupId");
}
}
/// <summary>
/// Shared XAxis VisibleRange for all charts
/// </summary>
public IndexRange XVisibleRange
{
get { return _xAxisVisibleRange; }
set
{
if (Equals(_xAxisVisibleRange, value)) return;
_xAxisVisibleRange = value;
OnPropertyChanged("XVisibleRange");
}
}
public ObservableCollection<BaseChartPaneViewModel> ChartPaneViewModels
{
get { return _chartPaneViewModels; }
set
{
if (_chartPaneViewModels == value) return;
_chartPaneViewModels = value;
OnPropertyChanged("ChartPaneViewModels");
}
}
public bool IsPanEnabled
{
get { return _isPanEnabled; }
set
{
_isPanEnabled = value;
OnPropertyChanged("IsPanEnabled");
}
}
public bool IsZoomEnabled
{
get { return _isZoomEnabled; }
set
{
_isZoomEnabled = value;
OnPropertyChanged("IsZoomEnabled");
}
}
private void SetPanMode()
{
IsPanEnabled = true;
IsZoomEnabled = false;
}
private void SetZoomMode()
{
IsPanEnabled = false;
IsZoomEnabled = true;
}
}
}
PricePaneViewModel.cs
View source code// *************************************************************************************
// SCICHART® Copyright SciChart Ltd. 2011-2022. All rights reserved.
//
// Web: http://www.scichart.com
// Support: support@scichart.com
// Sales: sales@scichart.com
//
// PricePaneViewModel.cs is part of the SCICHART® Examples. Permission is hereby granted
// to modify, create derivative works, distribute and publish any part of this source
// code whether for commercial, private or personal use.
//
// The SCICHART® examples are distributed in the hope that they will be useful, but
// without any warranty. It is provided "AS IS" without warranty of any kind, either
// expressed or implied.
// *************************************************************************************
using System;
using SciChart.Charting.Model.ChartSeries;
using SciChart.Charting.Model.DataSeries;
using SciChart.Examples.ExternalDependencies.Data;
namespace SciChart.Examples.Examples.CreateStockCharts.MultiPane
{
public class PricePaneViewModel : BaseChartPaneViewModel
{
public PricePaneViewModel(CreateMultiPaneStockChartsViewModel parentViewModel, PriceSeries prices)
: base(parentViewModel)
{
// We can add Series via the SeriesSource API, where SciStockChart or SciChartSurface bind to IEnumerable<IChartSeriesViewModel>
// Alternatively, you can delcare your RenderableSeries in the SciStockChart and just bind to DataSeries
// A third method (which we don't have an example for yet, but you can try out) is to create an Attached Behaviour to transform a collection of IDataSeries into IRenderableSeries
// Add the main OHLC chart
var stockPrices = new OhlcDataSeries<DateTime, double>() { SeriesName = "OHLC" };
stockPrices.Append(prices.TimeData, prices.OpenData, prices.HighData, prices.LowData, prices.CloseData);
ChartSeriesViewModels.Add(new CandlestickRenderableSeriesViewModel
{
DataSeries = stockPrices,
AntiAliasing = false,
});
// Add a moving average
var maLow = new XyDataSeries<DateTime, double>() { SeriesName = "Low Line" };
maLow.Append(prices.TimeData, prices.CloseData.MovingAverage(50));
ChartSeriesViewModels.Add(new LineRenderableSeriesViewModel
{
DataSeries = maLow,
StyleKey = "LowLineStyle",
});
// Add a moving average
var maHigh = new XyDataSeries<DateTime, double>() { SeriesName = "High Line" };
maHigh.Append(prices.TimeData, prices.CloseData.MovingAverage(200));
ChartSeriesViewModels.Add(new LineRenderableSeriesViewModel
{
DataSeries = maHigh,
StyleKey = "HighLineStyle",
});
YAxisTextFormatting = "$0.0000";
}
}
}
IndicatorPaneViewModel.cs
View source code// *************************************************************************************
// SCICHART® Copyright SciChart Ltd. 2011-2022. All rights reserved.
//
// Web: http://www.scichart.com
// Support: support@scichart.com
// Sales: sales@scichart.com
//
// IndicatorPaneViewModel.cs is part of the SCICHART® Examples. Permission is hereby granted
// to modify, create derivative works, distribute and publish any part of this source
// code whether for commercial, private or personal use.
//
// The SCICHART® examples are distributed in the hope that they will be useful, but
// without any warranty. It is provided "AS IS" without warranty of any kind, either
// expressed or implied.
// *************************************************************************************
using System;
using System.Collections.Generic;
using System.Linq;
using SciChart.Charting.Model.ChartSeries;
using SciChart.Charting.Model.DataSeries;
using SciChart.Examples.ExternalDependencies.Data;
namespace SciChart.Examples.Examples.CreateStockCharts.MultiPane
{
public class MacdPaneViewModel : BaseChartPaneViewModel
{
public MacdPaneViewModel(CreateMultiPaneStockChartsViewModel parentViewModel, PriceSeries prices)
: base(parentViewModel)
{
IEnumerable<MacdPoint> macdPoints = prices.CloseData.Macd(12, 26, 9).ToList();
var histogramDataSeries = new XyDataSeries<DateTime, double>() { SeriesName = "Histogram" };
histogramDataSeries.Append(prices.TimeData, macdPoints.Select(x => x.Divergence));
ChartSeriesViewModels.Add(new ColumnRenderableSeriesViewModel {DataSeries = histogramDataSeries});
var macdDataSeries = new XyyDataSeries<DateTime, double>() { SeriesName = "MACD" };
macdDataSeries.Append(prices.TimeData, macdPoints.Select(x => x.Macd), macdPoints.Select(x => x.Signal));
ChartSeriesViewModels.Add(new BandRenderableSeriesViewModel
{
DataSeries = macdDataSeries,
StrokeThickness = 2,
});
YAxisTextFormatting = "0.00";
Height = 100;
}
}
}
VolumePaneViewModel.cs
View source codeRsiPaneViewModel.cs
View source code// *************************************************************************************
// SCICHART® Copyright SciChart Ltd. 2011-2022. All rights reserved.
//
// Web: http://www.scichart.com
// Support: support@scichart.com
// Sales: sales@scichart.com
//
// RsiPaneViewModel.cs is part of the SCICHART® Examples. Permission is hereby granted
// to modify, create derivative works, distribute and publish any part of this source
// code whether for commercial, private or personal use.
//
// The SCICHART® examples are distributed in the hope that they will be useful, but
// without any warranty. It is provided "AS IS" without warranty of any kind, either
// expressed or implied.
// *************************************************************************************
using System;
using SciChart.Charting.Model.ChartSeries;
using SciChart.Charting.Model.DataSeries;
using SciChart.Examples.ExternalDependencies.Data;
namespace SciChart.Examples.Examples.CreateStockCharts.MultiPane
{
public class RsiPaneViewModel : BaseChartPaneViewModel
{
public RsiPaneViewModel(CreateMultiPaneStockChartsViewModel parentViewModel, PriceSeries prices)
: base(parentViewModel)
{
var rsiSeries = new XyDataSeries<DateTime, double>() { SeriesName = "RSI" };
rsiSeries.Append(prices.TimeData, prices.Rsi(14));
ChartSeriesViewModels.Add(new LineRenderableSeriesViewModel {DataSeries = rsiSeries});
YAxisTextFormatting = "0.0";
Height = 100;
}
}
}BaseChartPaneViewModel.cs
View source code// *************************************************************************************
// SCICHART® Copyright SciChart Ltd. 2011-2022. All rights reserved.
//
// Web: http://www.scichart.com
// Support: support@scichart.com
// Sales: sales@scichart.com
//
// BaseChartPaneViewModel.cs is part of the SCICHART® Examples. Permission is hereby granted
// to modify, create derivative works, distribute and publish any part of this source
// code whether for commercial, private or personal use.
//
// The SCICHART® examples are distributed in the hope that they will be useful, but
// without any warranty. It is provided "AS IS" without warranty of any kind, either
// expressed or implied.
// *************************************************************************************
using System;
using System.Collections.ObjectModel;
using System.Windows.Input;
using SciChart.Charting.Model.ChartSeries;
using SciChart.Charting.ViewportManagers;
using SciChart.Charting.Visuals.TradeChart;
using SciChart.Examples.ExternalDependencies.Common;
namespace SciChart.Examples.Examples.CreateStockCharts.MultiPane
{
public abstract class BaseChartPaneViewModel : BaseViewModel, IChildPane
{
private readonly CreateMultiPaneStockChartsViewModel _parentViewModel;
private readonly ObservableCollection<IRenderableSeriesViewModel> _chartSeriesViewModels;
private string _title;
private string _yAxisTextFormatting;
private bool _isFirstChartPane;
private bool _isLastChartPane;
private double _height = double.NaN;
protected BaseChartPaneViewModel(CreateMultiPaneStockChartsViewModel parentViewModel)
{
_chartSeriesViewModels = new ObservableCollection<IRenderableSeriesViewModel>();
_parentViewModel = parentViewModel;
ViewportManager = new DefaultViewportManager();
}
public CreateMultiPaneStockChartsViewModel ParentViewModel
{
get { return _parentViewModel; }
}
public ObservableCollection<IRenderableSeriesViewModel> ChartSeriesViewModels
{
get { return _chartSeriesViewModels; }
}
public IViewportManager ViewportManager { get; set; }
public string YAxisTextFormatting
{
get { return _yAxisTextFormatting; }
set
{
if (_yAxisTextFormatting == value)
return;
_yAxisTextFormatting = value;
OnPropertyChanged("YAxisTextFormatting");
}
}
public string Title
{
get { return _title; }
set
{
if (_title == value) return;
_title = value;
OnPropertyChanged("Title");
}
}
public bool IsFirstChartPane
{
get { return _isFirstChartPane; }
set
{
if (_isFirstChartPane == value) return;
_isFirstChartPane = value;
OnPropertyChanged("IsFirstChartPane");
}
}
public bool IsLastChartPane
{
get { return _isLastChartPane; }
set
{
if (_isLastChartPane == value) return;
_isLastChartPane = value;
OnPropertyChanged("IsLastChartPane");
}
}
public double Height
{
get { return _height; }
set
{
if (Math.Abs(_height - value) < double.Epsilon) return;
_height = value;
OnPropertyChanged("Height");
}
}
public void ZoomExtents()
{
}
public ICommand ClosePaneCommand
{
get; set;
}
}
}
StockChartHelper.cs
View source code// *************************************************************************************
// SCICHART® Copyright SciChart Ltd. 2011-2022. All rights reserved.
//
// Web: http://www.scichart.com
// Support: support@scichart.com
// Sales: sales@scichart.com
//
// StockChartHelper.cs is part of the SCICHART® Examples. Permission is hereby granted
// to modify, create derivative works, distribute and publish any part of this source
// code whether for commercial, private or personal use.
//
// The SCICHART® examples are distributed in the hope that they will be useful, but
// without any warranty. It is provided "AS IS" without warranty of any kind, either
// expressed or implied.
// *************************************************************************************
using System.Linq;
using System.Windows;
using SciChart.Charting.ChartModifiers;
using SciChart.Charting.Visuals.TradeChart;
namespace SciChart.Examples.Examples.CreateStockCharts.MultiPane
{
public static class StockChartHelper
{
public static readonly DependencyProperty ShowTooltipLabelProperty = DependencyProperty.RegisterAttached("ShowTooltipLabel", typeof (bool), typeof (StockChartHelper), new PropertyMetadata(default(bool), ShowTooltipLabelPropertyChanged));
public static void SetShowTooltipLabel(DependencyObject element, bool value)
{
element.SetValue(ShowTooltipLabelProperty, value);
}
public static bool GetShowTooltipLabel(DependencyObject element)
{
return (bool) element.GetValue(ShowTooltipLabelProperty);
}
private static void ShowTooltipLabelPropertyChanged(DependencyObject d, DependencyPropertyChangedEventArgs args)
{
var stockChart = d as SciStockChart;
if (stockChart != null)
{
var group = (ModifierGroup) stockChart.ChartModifier;
var cursor = group.ChildModifiers.SingleOrDefault(x => x is CursorModifier) as CursorModifier;
if (cursor != null)
{
cursor.ShowTooltip = (bool)args.NewValue;
}
}
}
}
}